Narc Mandreessen/It’s Not a Bubble If You’re the One Selling

It’s Not a Bubble If You’re the One Selling

The AI IPOs, and why your 401(k) is about to be very brave

Narc Mandreessen · November 2026

Narc MandreessenTo: Bagholders, Future
Fwd: Thursday Confidential

Somebody sent me this by accident. I read it at 3am, which is when I do my best reading and all of my posting.

I checked their math. Their sales need to grow about 40% a year for five years. Nobody this big has done that. I made up seven tests for whether they can. They pass two. My number is about 60% of the asking price.

If you’re an LP, delete this. If you’re a future bagholder, congrats. It’s your bag now.

Steelman me in the replies. I won’t see it. I’ve already blocked you, preemptively, as an act of love.

Narc

---------- Forwarded message ----------
From: ██████ <████@█████.vc>
Date: Mon, Nov 16, 2026 at 11:52 PM
Subject: Thursday
To: Limited Partners

Team,

Great news. After ten years of patient capital, AI is finally ready for its most important investor. The public.

Anthropic lists Thursday. OpenAI and SpaceX are right behind it. Over the next two years about $4.3 trillion of our stock becomes sellable, and for the first time somebody other than us gets to pay for the data centers.

A few reminders for the roadshow:

  • Don’t say “dump.” Say “democratizing access.”
  • If anyone asks about profits, say “it’s still the first inning.” There are nine innings. Each inning is a funding round.
  • If anyone asks about the price, say “software is eating the world” and leave before the follow-up.
  • Do not mention the lockup. If someone else mentions the lockup, say “aligned incentives” and check your phone.
  • If the stock falls, post “generational buying opportunity.” Do not buy.
  • Every newborn in America deserves exposure to AI. Ideally ours, at $74 a share.

This is Little Tech’s moment. Little Tech is now worth $2.55 trillion.

Best,
██████
Please do not forward.
What this essay covers

For years, venture capitalists and a few giant companies funded the development of AI. Now, for the first time, that burden is being handed to the public markets.

The big question is, will this handoff be a smooth transfer or result in a market correction, or worse, a recession?

And what would those scenarios mean for the markets, the economy, and everyday savers?

My answer, up front

My estimate: these AI companies are worth about of the asking price.$2.55 trillionAnthropic and OpenAI are priced at $2.55 trillion between them. My probability-weighted fair value is about $1.5 trillion: a little under $1 trillion for Anthropic, about three quarters of its price, and about $0.6 trillion for OpenAI, a bit under half of its. The range of outcomes is very wide, from a roughly 90% loss to about four times today’s price. The rest of this essay is how I got there.

Part 1

The Handoff

Let's start with the financing story. Over the past 10 years there have been three classes of investors funding AI, with the public set to be the fourth.

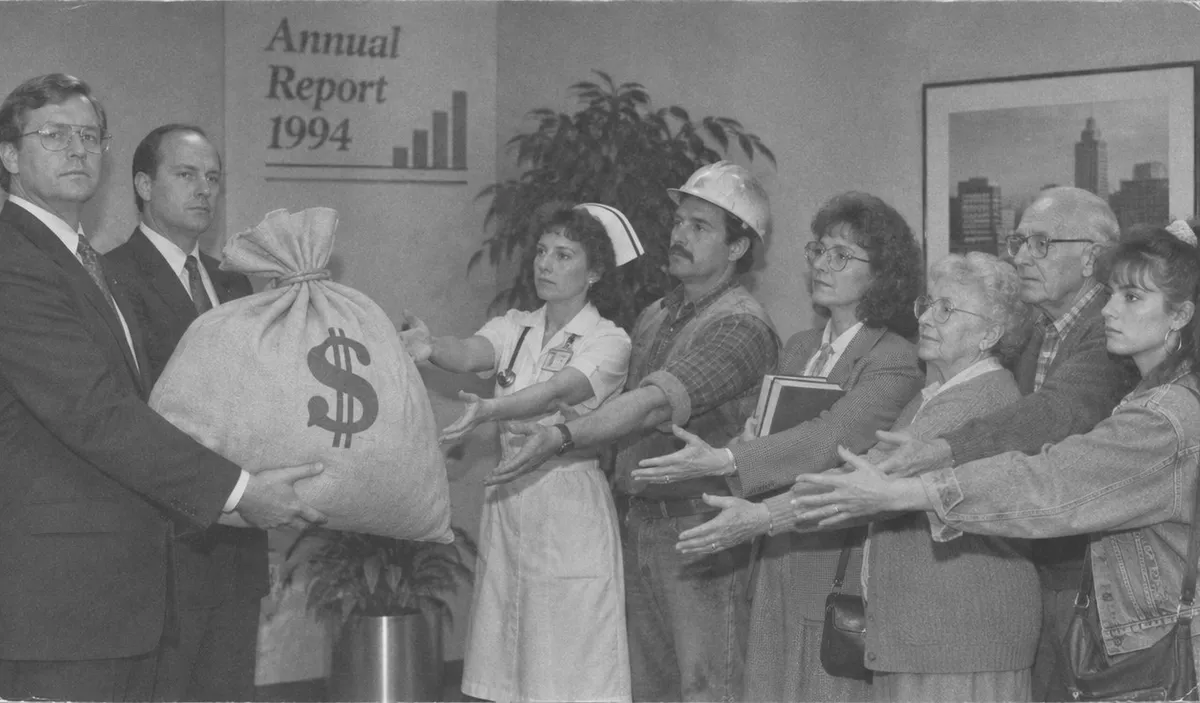
Photo of two men in suits handing a large sack to a group of ordinary people who reach out to take it

Who has funded AI up until now?

AI has had three sets of backers. Each time the capital requirements grew, a bigger backer stepped in. The public (aka exit liquidity) is the fourth and most recent.

Fig. 1. Money put into AI in each period, and who supplied it. Circle area is the amount: funding rounds for OpenAI, Anthropic and xAI, plus what Amazon, Google, Meta and Microsoft spent on data centers and equipment (Amazon's figure includes warehouses). The dashed ring is the $3.8 trillion of insiders' shares still to unlock. Sums are rounded. Google was AI's first large backer. It bought DeepMind in January 2014 for about $500 million and paid for its own research out of profits, which this figure does not count before 2023. In May 2015 Sam Altman wrote to Elon Musk that it would be good for someone other than Google to get there first, and OpenAI was founded that December. In June 2019 Microsoft's technology chief wrote that he was "very, very worried" about its gap with Google, a month before its first $1 billion. The first line under each backer is my reading of why it invested. Who they were, 2015 to 2022: Elon Musk, Sam Altman, Reid Hoffman, Peter Thiel and other donors to OpenAI; Jaan Tallinn, Dustin Moskovitz, Eric Schmidt and Sam Bankman-Fried at Anthropic; and Microsoft. 2023 to 2024: Amazon, Google, Meta and Microsoft built the data centers; Microsoft, Amazon and Google bought into the labs; the venture firms included Thrive, Spark, Menlo, Khosla, Sequoia, Andreessen Horowitz and Valor. 2025 to mid-2026: SoftBank, Amazon, Nvidia, Microsoft and Google, with growth and state funds including Thrive, Coatue, Altimeter, Lightspeed, ICONIQ, Fidelity, GIC, Qatar Investment Authority, MGX, Dragoneer, Greenoaks, Sequoia, D. E. Shaw, TPG, T. Rowe Price, Blackstone and Temasek, and the buyers of the cloud giants' bonds. Anthropic's filing shows $7.3 billion spent on computing in 2025 and $8.9 billion in the first half of 2026; it does not split training from serving customers. Not counted here: Oracle's data center spending (its bonds are in the borrowed total), CoreWeave and the other companies that rent out computing (CoreWeave alone owed $35 billion in June 2026), and loans raised for single data centers other than Meta's $27 billion vehicle.

Sources: OpenAI's funding (1, 2, 3); Anthropic's funding (1, 2, 3); data center spending; bonds (2025, 2026); round investors (Anthropic, OpenAI, xAI); spending (2023, 2026); Crunchbase check; OpenAI's founding (emails, counterweight, DeepMind); Microsoft's email; ChatGPT's first two months; Anthropic's computing costs; CoreWeave's debt

Every funding round at OpenAI and Anthropic

Who funded OpenAI and Anthropic, round by round

Bar length is the money raised, on one scale for both companies. A dashed bar is money promised and not yet paid. An outlined bar is a sale of existing shares, which brought the company no new money.

Each row names its source. Filing is Anthropic's IPO filing with the SEC, which lists every share it has sold. Company is the company's own announcement. Press is a news report that neither side confirmed. OpenAI has filed nothing with the SEC.

OpenAI

DateEventRaisedValue afterWho put the money inSource
Dec 2015Nonprofit launchAbout $135M of $1B pledged–Musk gave under $45M and other donors over $90M. Pledged by Elon Musk, Sam Altman, Greg Brockman, Reid Hoffman, Jessica Livingston, Peter Thiel, Amazon Web Services, Infosys and YC ResearchCompany
Jul 2019Microsoft$1B–MicrosoftCompany
2021MicrosoftNot disclosed–MicrosoftCompany
Jan 2023MicrosoftAbout $10BAbout $29BMicrosoft. Neither side gave the amount. Microsoft's filings put its total since 2019 at about $13BPress
Apr 2023Share sale$300M+$27B to $29BSequoia, Andreessen Horowitz, Thrive, K2 Global, Founders FundPress
Feb 2024Share saleNot statedAbout $86BThrivePress
Oct 2024Funding round$6.6B$157BThrive led. Microsoft, Nvidia, SoftBank, Khosla, Altimeter, Fidelity, MGX, Tiger GlobalCompany
Mar 2025Funding round$40B$300BSoftBank led with $30B. Microsoft, Coatue, Altimeter and Thrive put in the restCompany
Oct 2025Share sale$6.6B$500BBuyers not namedPress
Dec 2025Disney$1B–DisneyCompany
Mar 2026Funding round$122B$852BAmazon $50B, of which $35B waits on conditions. Nvidia $30B, SoftBank $30B. Andreessen Horowitz, D. E. Shaw, MGX, TPG and T. Rowe Price co-led. Microsoft, Blackstone, Sequoia, Temasek, and over $3B from individuals through their banksCompany
Aug 2026Share buybackAbout $7B$852BOpenAI bought from employeesPress
Nov 2026First close$11B of $30B sought$1.25TSoftBank, MGX, Coatue, T. Rowe Price, Sequoia, Founders Fund, Andreessen HorowitzPress

Anthropic

DateEventRaisedValue afterWho put the money inSource
May 2021Series A$124M–Jaan Tallinn led. Dustin Moskovitz, Eric Schmidt, James McClave, Center for Emerging Risk ResearchFiling
Apr 2022Series B$580M–Sam Bankman-Fried led. Caroline Ellison, Nishad Singh, James McClave, Jaan Tallinn, Center for Emerging Risk ResearchFiling
Feb 2023Google$300M–GooglePress
May 2023Series C$450MAbout $4.1BSpark Capital led. Google, Salesforce Ventures, Zoom Ventures, Sound VenturesFiling
Aug 2023SK Telecom$100M–SK TelecomCompany
Sep 2023Amazon$1.25B–Amazon, the first part of up to $4BCompany
Oct 2023GoogleUp to $2B, $500M at once–GooglePress
Jan to May 2024Series DAbout $1.2BAbout $18.4B54 investors, unnamed in the filing. The press named Menlo Ventures as leadFiling
Mar 2024Amazon$2.75B–AmazonCompany
Nov 2024Amazon$4B–AmazonCompany
Jan 2025GoogleAbout $1B–GooglePress
Mar 2025Series E$3.5B$61.5BLightspeed led. Bessemer, Cisco, D1, Fidelity, General Catalyst, Jane Street, Menlo, Salesforce VenturesFiling
Sep 2025Series F$13B$183BICONIQ led, with Fidelity and Lightspeed. Altimeter, Blackstone, GIC, Qatar Investment Authority, TPGFiling
Oct 2025Share resale$627M–Nine investors bought shares Anthropic took back from the U.S. governmentFiling
Nov 2025Nvidia and MicrosoftUp to $15B–Nvidia up to $10B, Microsoft up to $5BCompany
Feb 2026Series G$30B$380BGIC and Coatue led. D. E. Shaw, Dragoneer, Founders Fund, ICONIQ, MGX. Microsoft and Nvidia took partFiling
Apr 2026Amazon$5B, up to $20B more–AmazonCompany
Apr 2026Google$10B, up to $30B more–GoogleCompany
May 2026Series H$65B$965BAltimeter, Dragoneer, Greenoaks and Sequoia led. Capital Group, Coatue, D1, GIC, ICONIQ, XNFiling
Nov 19, 2026IPO, planned$61B, plus $26B placed privatelyAbout $1.3TThe public, at $70 to $78 a share. Seven companies buy the $26B alongsideFiling

Anthropic's filing counts $141.1 billion raised through June 2026. It also shows $10.2 billion lent by two investors since November 2023 and names Amazon as a lender. Series H includes $15 billion that Amazon and other cloud companies had already promised, so the rows overlap. Amazon and Google bought in April 2026 at $350 billion, the Series G price before its new money. Values that begin with "about" come from the press, as do the investor names in OpenAI's 2024 and 2025 rounds. OpenAI's 2015 backers gave donations and held no shares. Google paid for its own AI research from profits and appears here only as an investor in Anthropic.

Sources: Anthropic's IPO filing; the filing, round by round; IPO terms; OpenAI's own posts (2015, 2025, Feb 2026, Mar 2026); Amazon; press compilations (OpenAI, Anthropic)

When will the public take over?

From June 2026, the public becomes AI’s main funder. Before then, the money came from private rounds and bonds. From here on, stock sold to the public makes up most of it. On the chart below, you can look at each company to see its raises, as well as all of them at once.

Fig. 2. New money raised each quarter, by kind, for the six companies, xAI and Amazon: together by kind, together by company, or one at a time. The scale changes with the company picked. About $135 billion of 2026 bonds could not be split by company and appear only in the combined view. All of it goes to the companies; insiders selling their own shares is not counted here. Bond figures for 2026 are approximate, built from running totals that include Microsoft. Meta's late-2025 bonds include a $27 billion data center vehicle. $26 billion of Anthropic's IPO is sold privately.

Sources: OpenAI (1, 2); Anthropic; xAI; bonds (deal list, June, August, November); stock sales and rounds: Anthropic (1, 2, 3); OpenAI (1, 2); Google (1, 2); SpaceX; Oracle (1, 2); Meta

Why are these companies going public now?

Four things are happening at once.

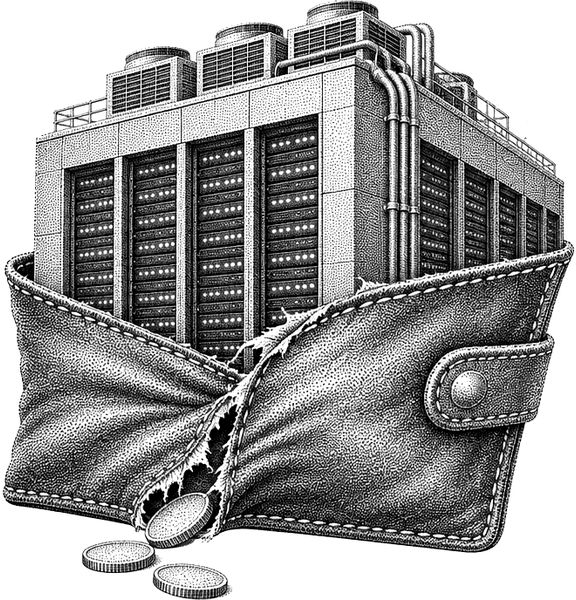
Stipple drawing of a data center bursting out of a wallet

Data center spending exceeded cash flow.

The four cloud giants budgeted $730 billion this year against $617 billion of cash from their businesses, an excess of $113 billion. Data centers took 115% of Google's operating cash last spring and 119% of Amazon's.

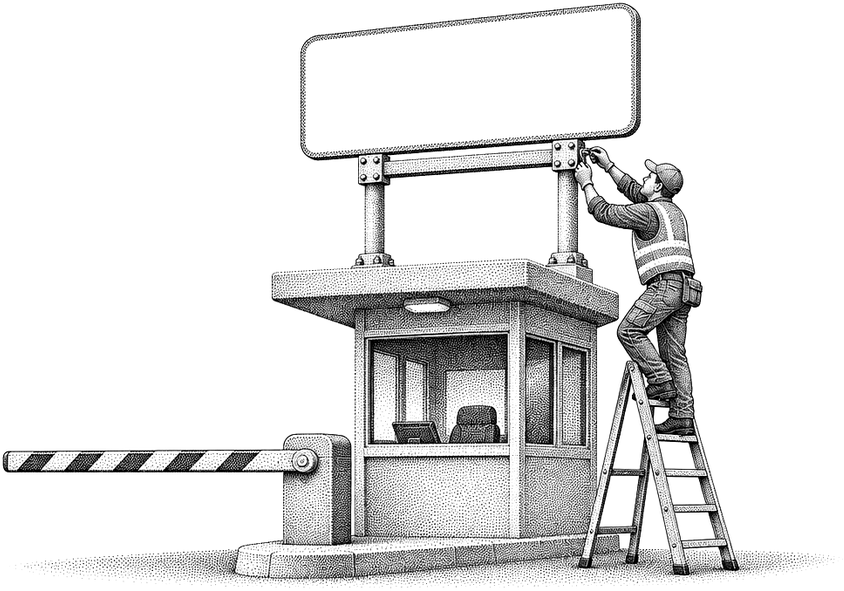
Stipple drawing of a worker raising the price sign on a tollbooth

Lenders want more compensation.

Borrowing went from $28 billion a year to $271 billion. That is more debt than buyers want at the old rates, so they ask more to hold it, and they see more risk in it. Meta paid 7.5% for 30 years this month against 6.3% in April. Oracle's five-year bonds yield 7.3%.

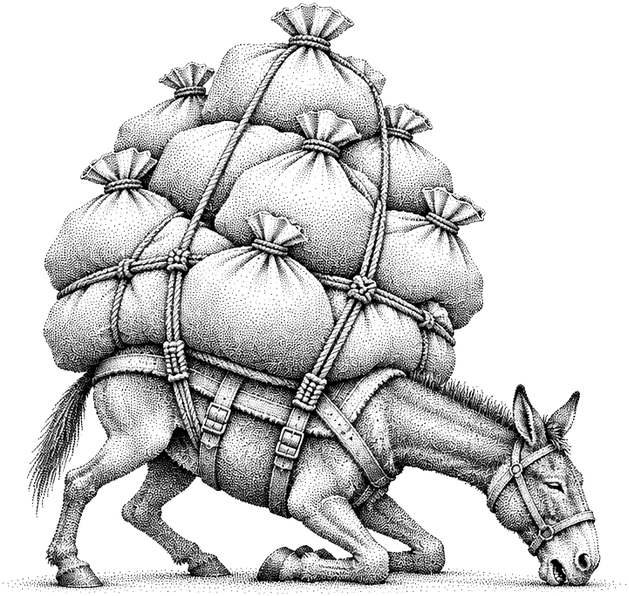
Stipple drawing of a pack mule buckling under money sacks

The amounts exceed what the largest growth investors can sustain.

OpenAI's last round was $122 billion. The biggest checks came from Amazon, Nvidia and SoftBank, and SoftBank sold $11 billion of bonds to pay its share. Thrive's fund is $10 billion and Sequoia's is $7 billion. OpenAI asked for $30 billion more this month and has $11 billion.

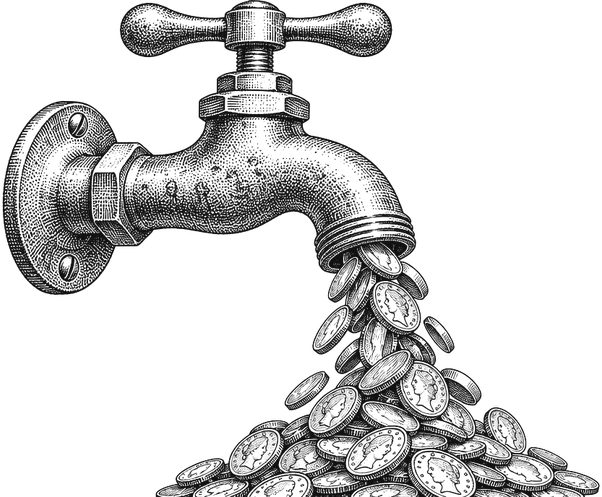
Stipple drawing of a faucet pouring coins

Early investors want to get liquid while valuations are still high.

Staff and early investors hold $3.8 trillion of shares they can sell only on a public market.

Fig. 3. Yearly spending on data centers and equipment by Amazon, Google, Meta and Microsoft. The 2026 bar is their own plan. The dashed line is their cash from operations in the year to March 2026, from ads, shopping, cloud and software: Google $174B, Microsoft $170B, Amazon $149B, Meta $124B. Meta's 30-year bonds paid 2.2 points more than Treasuries, up from 1.3 in April; the rest of the rise is higher Treasury yields. Bank of America counts about half a point of extra yield on the cloud giants' 10-year bonds this year, against a fifth of a point for other top-rated companies. JPMorgan Asset Management puts that down mainly to the amount of debt for sale, not to weaker businesses. Oracle's rate is the market yield on its bond due in 2031. OpenAI's $122 billion round closed in March: Amazon put in $50 billion, Nvidia $30 billion and SoftBank $30 billion, with venture, mutual and state funds behind them. SoftBank has put $64.6 billion into OpenAI in all. Abu Dhabi's MGX raised a $49 billion fund in July.

Sources: spending (2022 to 2023, 2024 to 2025, 2026); cash flow (year to March, last spring); borrowing (1, 2, Oracle); rates (Meta, spread, Oracle); OpenAI's round; investors (checks, SoftBank's bonds, fund sizes); why rates rose (JPMorgan, Bank of America)

How much stock comes to market in the next two years?

At today’s prices, $4.3 trillion of stock becomes sellable by May 2028. The IPOs are the small part: 90% unlocks when employees and early investors can sell for the first time. I expect about $1 trillion of it to actually be sold.

The public's purchase of shares will do two things: pay for the data centers, and buy out the early backers. The second is far larger.

Stock soldStock unlocked

Prices assumed. SpaceX at about $134 a share, Anthropic at $74, and OpenAI at its last round, with a listing forecast for July 2027. Google, Meta and Oracle are at market prices, and only the new stock they plan to sell is counted. This is the most that could come to market. From on, I assume 20% of unlocked stock sells and that Musk holds his.

Fig. 4. Stock reaching the market, added up month by month, June 2026 to May 2028. Solid color is stock sold. The lighter shade is stock unlocked. Everything after today is an estimate. OpenAI is a forecast: a July 2027 listing, then Anthropic's lockup calendar scaled to OpenAI's value.

Sources: company filings; SpaceX lockups; Anthropic lockups; Alphabet; Meta; Oracle

Company by company: how much comes to market?

Most of the $4.3 trillion coming to market from June 2026 to May 2028 is not new money for the companies. It is early backers cashing out.

When can insiders sell?

The chart below shows the unlock dates for SpaceX, Anthropic, and OpenAI through May of 2028. The biggest one happens on June 12, 2027, when Elon Musk's $858 billion stake in SpaceX frees up. This just so happens to coincide with the 12-month requirement for inclusion in the S&P 500.

A lockup is the wait before employees and early investors may sell. SpaceX sold 4.9% of its shares in its IPO and the rest must wait. Only the three new listings have lockups.

SpaceX, at about $134 a shareAnthropic, at $74OpenAI, forecastGoogle, Meta and Oracle were already public and have no lockups

Fig. 5. Every scheduled unlock to May 2028. Each bar is the most that could be sold from that day. Dates marked est. depend on earnings reports not yet scheduled. SpaceX sold 638.9 million shares, counting the extra allotment its banks took up, of about 13.15 billion: a float of 4.86%, or 4.2% before the allotment. S&P reviewed its rules in June 2026 and kept the 12-month wait, so SpaceX can first be considered in June 2027. It must also show a profit over its last four quarters and have at least 10% of its shares in public hands.

Sources: SpaceX schedule (Reuters table); Anthropic's lockup calendar; OpenAI is my forecast; float (Intropic, CNBC); S&P 500 rules

Part 2

Priced for a Miracle

These companies are priced like no company this big has ever grown, because none has. Here’s what you’re buying, how fast it has to grow, and seven tests for whether it can. The companies being sold to the public span four layers of the AI ecosystem. They are priced at 19 to 31 times their annual sales. Whether these prices end up being fair depends on how fast they can grow revenue and earnings.

These companies are changing quickly and spending heavily to grow, so nobody can say yet what their profit margins will be. That makes sales a more reliable yardstick than earnings for now, and it is the one I use.

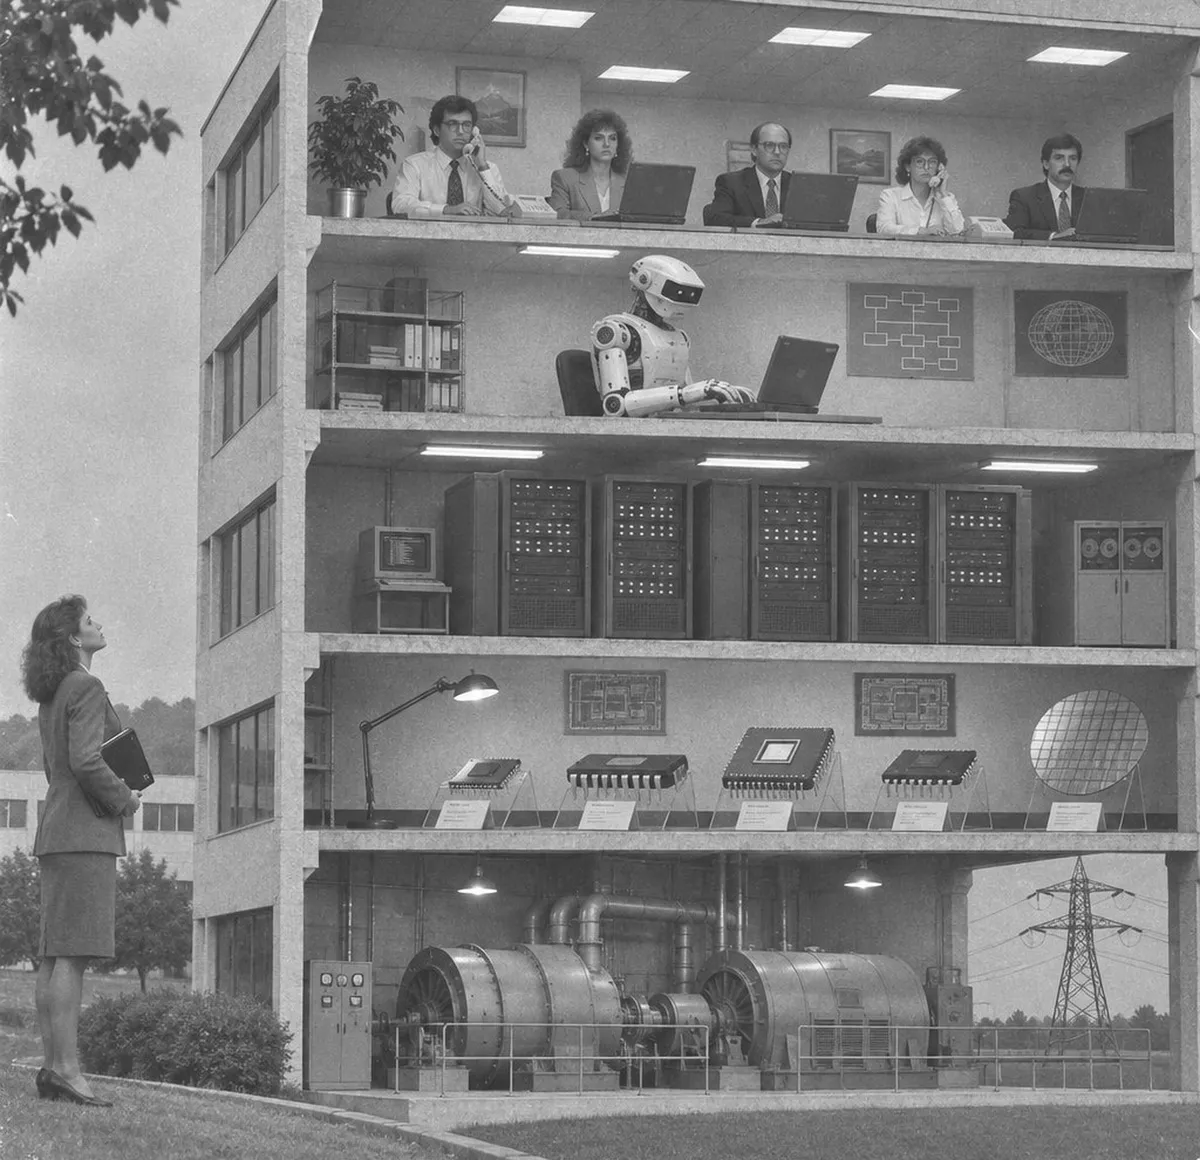
Photo of a five-story building cut open, with a power turbine at the bottom, then chips, server racks, a robot at a desk, and people with laptops on top, while a woman looks up from the street

What will the public be buying?

Mostly three companies, Anthropic, OpenAI and SpaceX, that together span the apps, the models and the data centers.

Fig. 6. The five layers of AI as Jensen Huang described them in January, and where the six companies sit. Huang resigned as Nvidia's chief on November 12. Each column is one stock. The layers are numbered from the bottom, as Huang did. A name in a cell means that buying the stock buys that layer. The bars under each name split the $4.3 trillion by company. SpaceX also sells rockets and satellite internet.

Sources: Jensen Huang at Davos; Ramp AI Index; Anthropic's filing; cloud spending plans; Steve Eisman; AI debt estimate

How expensive are the companies going public?

SpaceX, OpenAI and Anthropic are priced at 19 to 31 times their latest quarter’s sales, annualized. The fastest-growing tech companies trade at about 20. Nine earlier tech IPOs listed at 14 and were at 8 five years later. Google and Meta trade at 7. And even those comparisons are generous: the whole market is near its most expensive in 100 years.

Fig. 7. The price-to-sales ratio is market value divided by one year of sales. For SpaceX, OpenAI and Anthropic, and for Google, Meta and Oracle, which are also selling stock, it is four times the latest quarter. For the comparison companies it is the last four quarters, as of November 2026, and for the S&P 500 it is the forward ratio from August. The fast growers are eight listed companies whose sales grew between 22% and 56% in 2025: Palantir (55 times sales), Cloudflare (44), CrowdStrike (43), Arista (21), Snowflake (19), AppLovin (18), Datadog (16) and Shopify (13). The bar is their median, on the last four quarters of sales. On that same footing OpenAI is at 47 and Anthropic at 37. The basket's median was 41 at the end of 2021 and 11 a year later, after interest rates rose. I picked the eight for prominence, so they lean toward companies that have done well, and they are priced in one of the most generous markets on record; treat the bar as the bull case. The two IPO bars are the medians for nine earlier tech IPOs (Snowflake, Snap, Facebook, Alibaba, Tesla, Amazon, Lyft, Google and Uber): 14 times sales at the IPO price and 7.8 at the end of the fifth year. Every one of the nine was lower by then. Against earnings, the six with a profit have a median of about 106, and two lose money. The price-to-earnings view divides market value by profit over the last four quarters; the S&P 500 figure is the forward ratio on November 5. The dashed line is the S&P 500's own history: its forward price-to-earnings ratio has averaged 16.4 over 25 years and 19.1 over the last ten, and its price-to-sales ratio about 1.8 since 2000, measured on the last four quarters of sales. Anthropic's IPO roadshow gives a long-term model with an adjusted operating margin above 35% and no date; adjusted figures leave out stock pay. OpenAI has given no operating-margin target. Anthropic's filing shows sales of $16.3 billion against $2.4 billion of direct costs in the first half of 2026, and warns that will not last; it has pointed investors to break-even around 2028. OpenAI's adjusted gross margin was reported at 33% for 2025, with a target of 52 to 67% by 2029 and positive cash flow in 2030. SpaceX earned $2.8 billion from operations on $14.6 billion of sales last quarter, a 19% margin. Quarters end in August or September 2026. OpenAI's figures are reported estimates, since it publishes no accounts. Anthropic is valued at its IPO midpoint and OpenAI at its latest round. The 100-year line uses the S&P 500's price against ten years of profits. It is about 40 this month, against an average of 17 since 1871, and was higher only in 1999 and 2000 ().

Sources: Anthropic; OpenAI's forecast; SpaceX; Alphabet; Meta; Oracle; comparison ratios (CompaniesMarketCap, the basket, its growth, Tesla and Amazon, S&P 500); price-to-earnings ratios; S&P 500 P/E and its averages; S&P 500 price to sales since 2000; SpaceX's quarter; margins (Anthropic, its roadshow target, OpenAI)

How fast is revenue actually growing?

Pretty fast. Anthropic's sales grew 45 times in six quarters, and OpenAI's about five times, from about $2 billion a quarter to about $10 billion. Let's focus on Anthropic, the one going public first. Its customers spend nine times what they did a year ago. In October its yearly pace rose again, from $71 billion to $81 billion.

AnthropicOpenAIOpenAI, estimatedSpaceX, with xAI
Sales against the same quarter a year before
Anthropic12.3x
SpaceX2.6x
OpenAI2.3x
Oracle1.30x
Meta1.26x
Google1.25x

Fig. 8. Sales by quarter, and three measures of demand a year apart. SpaceX's quarters are recast to include xAI and X; most of its third-quarter jump is computing sold to other companies, including a six-month cloud contract worth $6.7 billion. The comparison strip divides each company's sales in the third quarter of 2026 by the same quarter of 2025; OpenAI's are estimates. Google, Meta and Oracle are compared by growth rather than drawn on the chart, because their sales are many times larger. Anthropic's amended filing puts its yearly pace at about $81 billion on October 31, up $10 billion in a month. Press reports say it expects about $19.3 billion of sales in the fourth quarter, 14% more than the third and a yearly pace of about $77 billion, a little under October's, with price cuts and the holidays given as reasons. It has not confirmed that. 79% of its sales are fees for use. Computing cost it $1.48 per $1 of sales a year ago and 58 cents last quarter. Its quarterly growth fell from 144% to 47%. Anthropic's figures come from its IPO filing. OpenAI publishes no accounts: its 2026 figures are as reported by The Wall Street Journal and The Information. The spending measure leaves out monthly subscriptions. McKinsey surveyed 1,719 people, mostly at larger companies; profit means earnings before interest and taxes, and a large share means 5% or more of it.

Sources: October and the fourth quarter (the filing, the projection); Anthropic's filing (1, 2, 3); OpenAI (1, 2, 3); demand (filing, summary, coding); Census Bureau (latest, by size); McKinsey survey

What growth rates would justify these prices?

For buyers at today’s prices to earn 10% a year, about what stocks have returned over the long run, Anthropic and OpenAI’s sales together need to grow about 40% every year for five years. That assumes investors then pay about $7 for every $1 of yearly sales, as they do for Google today (), and that today’s holders keep about nine tenths of the companies after the new shares the labs still have to sell.

If investors pay more, say $20 like they do for today’s fastest growers, 14% a year would be enough. If they pay what the stock market pays on average, about $3.30, it takes 64%. The labs themselves plan for 70 to 77% a year, faster than any company on record. Separately, Anthropic needs about 37% a year and OpenAI about 45%.

Fig. 9. The two labs' combined sales, $118 billion a year today, compounded at each rate. The gray and amber lines are what their combined price of $2.55 trillion needs for buyers to earn 10% a year: $4.1 trillion of value in 2031, plus about a tenth for new shares, divided by the ratio. The new shares are the $278 billion OpenAI's plan still needs from investors, sold at today's price. The colored lines apply each plan's pace to the combined figure. The claim that no company has grown as fast as OpenAI plans to is Morgan Stanley's, from 75 years of American companies. I extend Anthropic's 2028 target and OpenAI's 2030 plan to five years; the 70% is my arithmetic. OpenAI's 77% is its plan's $36 billion of sales in 2026 growing to $350 billion in 2030.

Sources: Tesla's individual shareholders, Bloomberg data via Benzinga, July 2025; Pew; jobs (Yale Budget Lab, Anthropic's study); McKinsey; app revenue (Statista series, early years, data.ai 2017 to 2018, 2021 to 2022, 2023); Morgan Stanley; Morningstar; Anthropic's filing; Axios; Ramp; Reuters

What can history teach us? What happened to $100 put into earlier tech IPOs?

Below are ten of the most prominent tech IPOs from the last thirty years. In seven of ten, $100 at the IPO price was worth more five years later, and in four it was worth at least $400. Snap lost half, and Lyft and Rivian lost more than 80%.

$100 became $400 or more in five yearsThe other six

So why did some win big and others lose? It comes down to growth.

Fig. 10. Share prices of the ten IPOs in Fig. 39, measured from the IPO price and adjusted for stock splits. Touch a line for the IPO date and price. The scale is in multiples, so equal steps are equal percentage changes. Year-end points are approximate: they are chained from each year's price change and tied to the close at the end of the fifth calendar year. Ten years on is the end of the tenth calendar year. Dividends are left out. Buyers at the IPO price did better than buyers on the first day of trading, when most of these shares opened higher.

Sources: yearly price changes (CompaniesMarketCap); IPO terms and year-five closes as in Fig. 10; prices today

What was the relationship between growth and their price-to-sales ratio?

As growth slowed, the price-to-sales ratio fell for every one of these companies. IPO buyers made money only when sales grew faster than the ratio fell. So expect the labs’ ratio to land near a mature tech company’s, like Google’s 7.

What sales growth alone would have made of $100What $100 became in five years

At that ratio, the labs need 41% growth a year for five years (). Seven of these ten managed it, but each started under $10 billion of sales. The labs start at $118 billion.

Fig. 11. Nine of the best-known technology IPOs since 1997, from the IPO price to the end of the fifth calendar year after listing. A share price is sales, times the price-to-sales ratio, divided by the number of shares, so the price change splits three ways. The light bar is $100 times the growth in sales. The ratio column compares the value at the IPO price over the prior four quarters of sales with the year-five ratio. The last column is what is left over: mostly new shares issued, plus the mismatch between fiscal years and year-end prices. Rivian, the tenth, listed with almost no sales and is left out; $100 of it is worth $17. Dollar outcomes follow the share price and leave out dividends. The year-by-year lines are in the appendix. I chose these companies for prominence. They are not a random sample. Why Google as the stand-in: at each year-end from 2014 to 2024 its ratio averaged 6 and ranged from 4 to 7.4, and the nine IPOs here averaged 7.8 in their fifth year, so 7 has two separate supports. It leans generous. Google keeps more of each sales dollar than the labs do today, its 7 is above its own ten-year norm, and its price already includes its own hopes for AI. Microsoft at 11 and Amazon at 3.6 mark the range for very large tech companies. The gap between the two bars is what a falling price-to-sales ratio and new shares took back. Under each name is how fast its sales grew a year.

Sources: Google's ratio by year; IPO terms and sales (Amazon, Google, Tesla, Facebook, Alibaba, Snap, Uber, Lyft, Snowflake, Rivian); annual sales; year-end prices (1, 2); prices and ratios today; ratios by year (CompaniesMarketCap, Google before 2014, Amazon before 2001)

How much does fast growth hold up the price-to-sales ratio?

Only so much. Even in years when sales grew 50% or more, these companies were typically valued at about 13 times sales. The labs are at 19 to 25.

Fig. 12. Each bar is the median year-end price-to-sales ratio across the years in that band of sales growth: 78 company-years for Amazon, Google, Tesla, Facebook, Alibaba, Snap, Uber, Lyft and Snowflake, from the year after each IPO to ten years on or 2025. Growth is the change in reported yearly sales. The bands hold 25, 19, 20 and 14 years. Nine companies is a small sample, chosen for prominence, and Amazon in 1998 and Snowflake in 2021 pull the top band up. Even in years when sales grew 50% or more, the ratio fell 19 times out of 23, and it rose only when growth beat what the price already assumed. In the end the ratio equals profit margin times the price-to-earnings ratio: a company that keeps 30 cents of each sales dollar as profit, valued at the S&P 500's 17.7 times profit, trades at about 5 times sales. An example from these numbers: $100 of sales at 13 times is worth $1,300; if sales grow 20% the next year, a pace that earned 5 times here, $120 of sales is worth about $610. Anthropic's roadshow targets an adjusted operating margin above 35%.

Sources: yearly sales (Amazon, Google, Tesla, Facebook, Alibaba, Snap, Uber, Lyft, Snowflake); ratios by year (CompaniesMarketCap, Google before 2014, Amazon before 2001)

What else moves the price-to-sales ratio?

Interest rates and recessions. When rates are high or the economy shrinks, investors usually pay less for stocks. Today rates are high, yet stocks are as expensive as they were only once before, in 1999 and 2000.

5%10%15%102030401960197019801990200020102020Interest rate: the 10-year Treasury yieldRecessionPrice-to-earnings ratio of the S&P 500its price divided by its average yearly profit over the past ten years14.6% in 19821.1% in 20215.2% now97 in 198244 in 200015 in 200940 now
102030400%5%10%15%10-year Treasury yield at the start of each yearS&P 500 price-to-earnings ratio, on ten-year profits2000Now198220212009The pattern

Stocks haven’t adjusted to higher rates. As rates fell from 15% to 1% over forty years, the price-to-earnings ratio rose from 7 to 35. Rates are back at 5%, which would put it near 23. It’s 40.

See the data, year by year

The data behind this chart

Each row is one year: the year, the 10-year Treasury yield at the start of it, and the S&P 500's price-to-earnings ratio at the start of it. The ratio is the index level divided by its average yearly earnings per share over the previous ten years, adjusted for inflation. Robert Shiller of Yale publishes it. It covers the S&P 500 only, and the Nasdaq is not in it. The last row is the close on November 13, 2026.

19604.72%18.3
19613.84%18.5
19624.08%21.2
19633.83%19.3
19644.17%21.6
19654.19%23.3
19664.61%24.1
19674.58%20.4
19685.53%21.5
19696.04%21.2
19707.79%17.1
19716.24%16.5
19725.95%17.3
19736.46%18.7
19746.99%13.5
19757.50%8.9
19767.74%11.2
19777.21%11.4
19787.96%9.2
19799.10%9.3
198010.80%8.8
198112.57%9.3
198214.59%7.4
198310.46%8.8
198411.67%9.9
198511.38%10.0
19869.19%11.7
19877.08%14.9
19888.67%13.9
19899.09%15.1
19908.21%17.1
19918.09%15.6
19927.03%19.8
19936.60%20.3
19945.75%21.4
19957.78%20.2
19965.65%24.8
19976.58%28.3
19985.54%32.9
19994.72%40.6
20006.66%43.8
20015.16%37.0
20025.04%30.3
20034.05%22.9
20044.15%27.7
20054.22%26.6
20064.42%26.5
20074.76%27.2
20083.74%24.0
20092.52%15.2
20103.73%20.5
20113.39%23.0
20121.97%21.2
20131.91%21.9
20142.86%24.9
20151.88%26.5
20162.09%24.2
20172.43%28.1
20182.58%33.3
20192.71%28.4
20201.76%31.0
20211.08%34.5
20221.76%36.9
20233.53%28.3
20244.06%32.0
20254.63%37.1
20264.21%39.6
Nov 135.15%40.0

Sources: the ratio by year, the yield by year and the one-year ratio, all from multpl.com

Fig. 13. Left: the 10-year Treasury yield and the S&P 500's price divided by its average yearly profit over the previous ten years, adjusted for inflation. This is Robert Shiller's version of the price-to-earnings ratio. The usual version uses one year of profit, which collapses in a recession and makes the ratio jump for a year; averaging ten years removes that, at the start of each year from 1960, with a last point for November 13, 2026. Shaded bands are recessions as dated by the National Bureau of Economic Research. Right: the same 67 yearly readings plotted against each other. Hover over or tap any point to see its year. The dashed line is the straight line that fits them best; it explains about 45% of the differences between years, so it is a tendency and not a rule. The ratio roughly halved in three slumps: from 19 to 9 between 1973 and 1975, from 44 to 23 between 2000 and 2003, and from 27 to 15 between 2007 and 2009. In the ten recessions since 1955, profits fell 16% on average and share prices about 30%, so buyers also paid less for each dollar earned. Why rates matter: $1 of profit due in ten years is worth 61 cents today at a 5% rate and 56 cents at 6%, and the further off the profit, the bigger the cut. In 2022 the yield rose from 1.51% to 4.05% and the S&P 500's forward price-to-earnings ratio fell from 22.3 to 16.7, while listed software companies went from near 15 times sales to 5.4. In 1999 and 2000 the Fed raised its rate six times, from 4.75% to 6.5%, and a recession followed in 2001. On average since 1989, a surprise quarter-point cut by the Fed has lifted share prices about 1% that day (Bernanke and Kuttner, 2005). The labs sell by the meter: 79% of Anthropic's sales are fees for use, which a customer can cut in a month. How I get 40: the S&P 500’s level at the close on November 13, divided by its average yearly profit over the past ten years, adjusted for inflation. On the past twelve months of profit alone it is 26, against a long-run average of 16.

Sources: the ratio by year; the 10-year yield by year; 2022 (AllianceBernstein, software 1, 2); Bernanke and Kuttner; recessions (Putnam, falls); the Fed in 1999 and 2000

Can the labs actually grow this fast?

Only if seven things go right. I call it Narc’s Revenue Plausibility TestTM. The first four ask whether AI works. The last three, on the next slide, ask whether the labs get paid.

Part one: Does AI work?
Stipple drawing of a robot hand writing with a pencil

1. Can AI do useful tasks?

AI has to do work that people used to do.

Yes, and more each month.Task length doubles about every four months in software.

Stipple drawing of a coffee cup tipping over and spilling

2. Can AI do these tasks reliably?

AI has to finish often enough that fixing its mistakes costs less than its help is worth.

Not yet.One try in five still fails on 3-hour tasks.

Stipple drawing of a balance scale with a robot head on one pan and a bowler hat on the other

3. Can AI do these tasks for less than a person costs?

Count the tokens, the failed tries, and the person's time checking the work.

?Sometimes.On simple tasks, $1 to $2 against $25 for a person.

Stipple drawing of a hard hat, a stethoscope and a chef's knife

4. Can AI do all three across the broader economy?

Most of the economy sits outside programming and mathematics, where these models gain from brute force.

Not yet, and improving fast.16% of real freelance projects done to a client’s standard, up from 2.5%.

So far: one yes, one sometimes, two not yet.

Fig. 14. More detail on each answer: about half the AI-written fixes that pass a leading coding test would be rejected by the people who maintain the code. Longer jobs use 5 to 30 times the tokens of a simple one, and the cost estimates have huge error bars. Coding is still 35% of what people do with Claude. The brute force is trying every permutation, and extremely thorough review and analysis. Task length is METR's measure: how long a task takes a person, for tasks AI completes half the time, or four times in five. The evidence on cost is thin: one academic study of tasks suited to agents, a Gartner estimate of token use, and one investor's account on the All-In podcast of agents that ran $300 a day each and did part of one job. On a screen with a mouse, METR finds AI manages work 40 to 100 times shorter than in software. The falling price is for a fixed level of benchmark performance: an MIT study finds 5 to 10 times a year, and Epoch AI's tracker 40. The freelance figure is the Remote Labor Index from Scale AI and the Center for AI Safety, which grades whole projects a client had already paid a person for. Studies of exposure estimate what AI could touch, not what it does: OpenAI's 2023 study put about 80% of American workers in jobs where at least a tenth of the tasks are exposed, and 19% where at least half are. Gartner also expects AI coding to cost more than the developer's salary by 2028. More evidence that the first three are not yet met: McKinsey finds 37% of companies can tie AI to any profit, the same as last year; Yale's Budget Lab finds no link between AI use and employment; in a 2025 METR trial, 16 experienced programmers took 19% longer with AI and believed they were 20% faster, though METR now thinks the tools probably do speed work up; and in a February 2026 survey of nearly 6,000 executives, more than 80% said AI had not changed productivity at their firms. The four verdicts and the last line are my reading. The verdicts in detail. Useful tasks: in software, the length of task AI can finish doubles about every four months, and in May the best model finished 16-hour tasks half the time. Reliability: the same model finished 3-hour tasks four times in five. Cost: on simple tasks, agents cost $1 to $2 against $25 for a person; it is unclear what share of tasks this applies to. Breadth: on real freelance projects, the best AI agent finished 16% to a paying client’s standard in July, up from 2.5% eight months earlier.

Sources: METR (task length, rejected fixes, other fields); cost per task (the study, token use, the $300 agents, Gartner on coding costs); falling prices (MIT, Epoch AI); Remote Labor Index (July results); Anthropic Economic Index; exposure by occupation; McKinsey; Yale Budget Lab; productivity (trial and survey, METR)

Even if AI works, will the labs get paid?

The last three tests of Narc’s Revenue Plausibility TestTM. These are about people and money, not the technology.

Part two: Do the labs get paid?
Stipple drawing of a tortoise pulling a cart of coins

5. Will people adopt it fast enough?

Habits, trust and ways of working change slower than the technology does, and the stock can’t wait.

Not yet.Three in four American businesses haven’t started (). More than 80% of executives say AI hasn’t changed productivity at their firms, and 37% of companies can tie it to any profit. Insiders can sell by May 2028 (), and the price needs $650 billion of sales a year by 2031. With smartphones, revenue trailed adoption by about five years.

Stipple drawing of a small robot sitting on top of a desktop computer

6. Will the money go to the labs?

Customers could run open models themselves, or buy from Google or the cloud companies.

?Under pressure.Open models already do 72% of the work on OpenRouter for 27% of the money (), and the best trail the closed ones by only about four months. A rival can also distill a leading model into a cheaper copy.

Stipple drawing of a price tag

7. Will spending grow faster than prices fall?

If AI gets ten times cheaper each year, use has to grow more than tenfold just to keep sales flat.

So far, yes.A model at the frontier tends to be about ten times cheaper within a year, yet spending on AI has doubled as prices fell, because each job uses more of it.

The scorecard: two yes, one sometimes, three not yet and one under pressure. If the optimists are right on all seven, sales can grow into these prices, and a smooth handoff is likelier than the 10% chance I give it. The bulls’ answer on money: costs are falling even faster than prices, and Anthropic’s margin on running its models jumped from 38% to over 70% this year, by SemiAnalysis’s estimate.

Fig. 15. The last three tests: whether the labs get paid even if AI works. The verdicts are my reading. The adoption evidence is from the Census Bureau's business survey () and the surveys on the previous slide. From December Google's top model lists at $4 in and $20 out per million tokens, against $10 and $50 at the labs. Anthropic's margin rose after it cut its top model's list price by two-thirds; counting the computing that trains the next model, its filing shows 45% for the first half of 2026, with a small loss after all costs. Google's top model costs $2 and $10 until November 30, and a lighter one is free in Search. Open models charge about a quarter of closed prices on OpenRouter. SemiAnalysis's figure is an inference margin: sales less the computing used to answer customers. It also finds open models have put little pressure on the labs' prices so far. Anthropic's filing for the first half of 2026 shows $16.3 billion of sales, $2.4 billion of computing to serve customers, and $6.6 billion of computing for training and research, which it books as research. Its operating loss for the half was $0.7 billion. Palihapitiya's comparison is from the All-In podcast. On timing, half of American adults had a smartphone by 2013, and app revenue passed half its 2023 level in 2018. The electric dynamo arrived in the early 1880s and the surge in factory productivity came in the 1920s, as Paul David showed in "The Dynamo and the Computer" (American Economic Review, 1990). Customers are rationing too: the heaviest spenders cut AI spending per employee 9.7% in August. Chamath Palihapitiya puts a million tokens at about $26 from OpenAI and 50 cents from Chinese providers.

Sources: McKinsey; Yale Budget Lab; productivity (trial and survey, METR); OpenRouter (work and prices, spending, January); Epoch AI; Apple and Meta (1, cost); Broadcom survey; company use; Anthropic's filing; math test; Google (prices, free tier, labs' prices); Karp (1, 2); Nadella; prices (tenfold a year, Ramp, spending); SemiAnalysis on margins; Anthropic's computing costs (the split, the operating loss); Palihapitiya on prices; smartphones (Pew, app revenue)

Part 3

The Circle

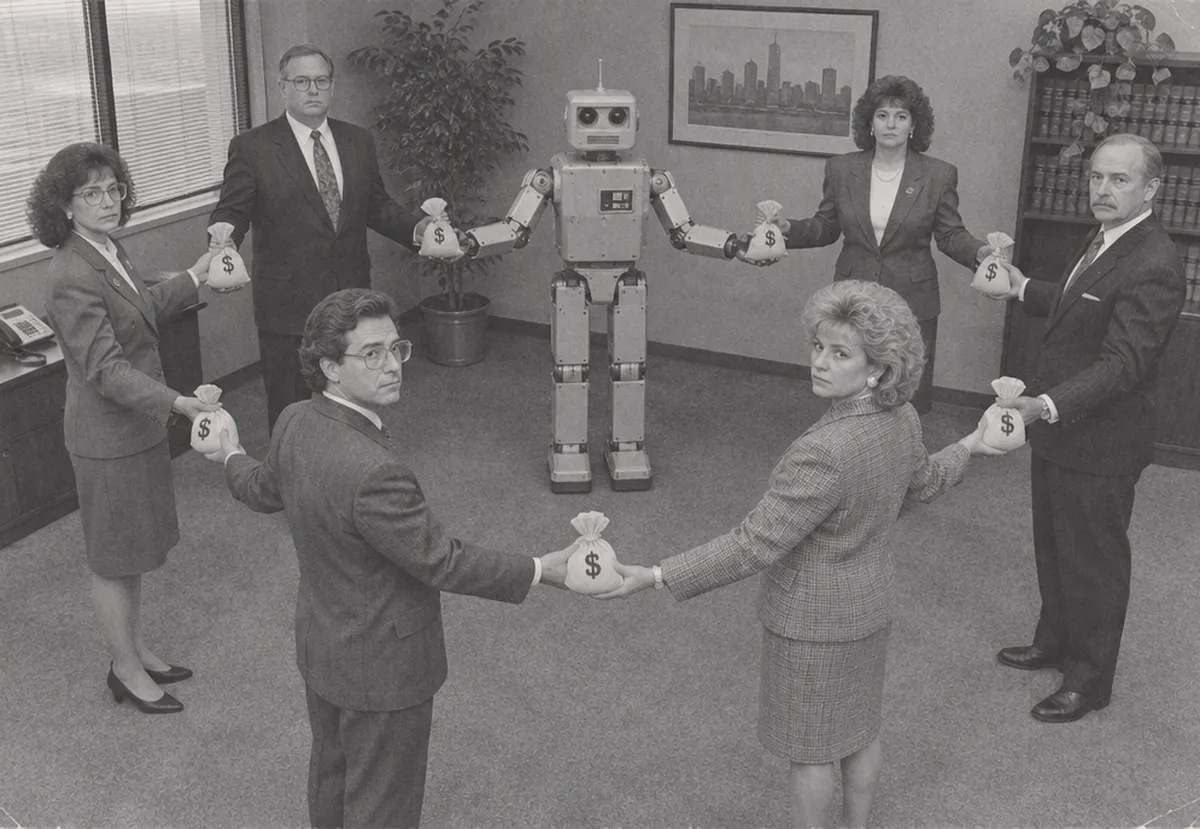
These companies are each other’s biggest customers and investors, so if one stumbles, the rest feel it. OpenAI and Anthropic rent computers from the giants that build data centers: Google, Amazon, Microsoft and Oracle. Those giants, and the chip maker Nvidia, own pieces of OpenAI and Anthropic. The money goes around in a circle.

Photo of six people in suits standing in a ring, passing sacks from hand to hand around a robot

How does money currently flow through the AI ecosystem, and who's paying?

For every dollar customers pay for AI, investors and the cloud giants put in about eleven. Customers paid the two labs $118 billion this past year; the cloud giants’ older businesses and investors put up $1.3 trillion.

The assumption. Every layer below has spent as if the thin top arrow will widen. If it does, customers carry the stack. If not, investors have paid for it.

Fig. 16. Who pays for the stack this year. Arrow widths are in proportion to dollars, except the labs' multi-year promises. The data center owners take in more than they spend on chips and buildings; the rest pays for their other businesses. Customer revenue is the two labs' latest quarter times four. Investor money is this year's private rounds, new stock and bonds.

Sources: as in Figs. 2 and 3; Anthropic's 2028 target; OpenAI's plan; utility spending; OpenAI's round

How are the companies tied together?

Here's a more detailed look at some of the financing relationships between the specific companies.

What a lab has promised to pay a supplierWhat a supplier has invested in its customerCircle size is company value

Fig. 17. Oracle is the weakest link. It borrowed to build data centers for OpenAI, and it can only carry that debt if OpenAI's $300 billion contract pays. OpenAI does not start paying until 2027. Oracle owes $125 billion and is rated one notch above junk. Insuring its debt costs a record 2.9% a year, against 1.4% for Nvidia's. The largest links only; Fig. 19 lists them all. Circle area is market value or the latest private price. Amounts are multi-year totals. Bloomberg and The New York Times drew the best-known maps of these loops in October 2025. Nvidia's founder and chief, Jensen Huang, resigned on November 12, and its stock is about 31% below its October high. Nvidia says its customer commitments stand.

Sources: Nvidia; Oracle's debt (1, 2); Anthropic's filing; Oracle; Steve Eisman; OpenAI's round; Federal Reserve; ING; Amazon and OpenAI; Google and Anthropic; IPO placement; Meta; market values (1, 2); Bloomberg's map

How does the money go in a circle?

Take Google and Anthropic. Google invests in Anthropic, Anthropic spends the money on Google’s cloud, and Google counts it as sales. It’s called round-tripping. It’s legal and disclosed, and the same pattern runs between Amazon, Microsoft, Nvidia and both labs.

Googlethe supplier Anthropicthe customer 9.9% stakeGoogle buys shares, nowworth about $130B Anthropic promises to spendat Google Cloud by 2033$121B123
1

Google buys part of Anthropic.

After the IPO it will own 9.9%, worth $126 billion to $139 billion.

2

Anthropic promises to spend the money at Google.

At least $121.3 billion on Google Cloud between 2026 and 2033, whether it uses the computers or not. That is the round trip: money Google put in comes back to Google as sales.

3

Google counts it twice.

Once as orders and once as profit. The promise is about a fifth of Google Cloud's $561 billion of future orders. And when Anthropic's value rose, Google booked the gain as profit: $99 billion in one quarter, mostly from Anthropic and SpaceX. That was more than two-thirds of the quarter's $112 billion.

Nothing here is hidden, and Anthropic’s customers are real. But part of these sales exists only because the investments keep coming. If they slow, the loop runs in reverse: less investment means less cloud spending, and less reported sales for the giants.

Fig. 18. One loop, from public filings. Part of Google's orders, and most of one quarter's profit, trace back to a company Google itself funds; Google also resells Claude through its cloud. Google will hold 1.79 billion Anthropic shares after the IPO and the $10 billion it is buying alongside it; the value is at the $70 to $78 price range. The spending promise runs from April 2026 to July 2033 and is a minimum. Google Cloud's backlog, its signed future orders, was $560.8 billion on September 30. Alphabet's second-quarter profit of $112.1 billion included $99 billion of gains on its investments before tax, which added $77.1 billion after tax; it does not split the gain between Anthropic and SpaceX. Round-tripping is the name for the illegal version, where the sales are disguised. These are disclosed.

Sources: the stake and the promise (Trefis, backlog); Fortune on the quarter's profit; the three clouds' contracts

How much have they promised each other?

The labs have promised their suppliers $1.27 trillion, six times the $210 billion those suppliers have pledged back. A third of that has yet to arrive.

Still to arrive: Amazon's $35 billion, $20 billion from Google, and $12.5 billion from Nvidia and AMD at Anthropic's IPO.

OpenAIAnthropicMetaSolid bars rise with what a lab has promised. Dashed bars hang below with what the supplier put into the lab.

Fig. 19. Every disclosed link, on one scale. Promises run over several years. Anthropic's come from its IPO filing, which also lists $45 billion to Nscale and $41 billion to Lambda. Broadcom's $42 billion of notes is matched across two filings that do not name each other. Oracle's figure is as reported. Amazon's $35 billion for OpenAI reportedly waits on OpenAI going public. Anthropic's filing says Google can still put in up to $20 billion, $10 billion of it as an option at the IPO and the rest tied to targets.

Sources: Anthropic's filing (1, 2, 3); OpenAI's contracts (1, 2); Nvidia's stakes; IPO placement; Meta's sale (1, 2); The New York Times; unpaid amounts (Amazon, Google)

How big is the circle?

The circle is $1.4 trillion of spending the labs have promised back to their own investors: twelve times what customers paid the labs this year.

Two thirds of it is the suppliers’ own money coming back to them as sales. That makes the circle fragile. If the suppliers stop investing, their sales fall faster than real demand, and the $650 billion of loans is still owed. The remaining $450 billion has to come from paying customers or new investors. And the IMF’s count is conservative: a private count by Sona, a London fund, finds 176 such deals worth $3.6 trillion.

Suppliersand lenderschip makers, clouds, banks AI labs anddata centerstheir customers $950Bin: $300B of shares, $650B of loans Google and Anthropic’sloop, same scale promised back as spending$1.4T THE $1.4 TRILLION, BY WHO PAYS FOR IT $950Bthe suppliers' own money, coming back $450Bfrom customers or new investors

So what happens if the customer money doesn’t arrive in time? Take OpenAI.

Has this happened before? The last boom, and 2008

Revenue that went in a circle, in the last boom

In the telecom and internet boom of 1999 to 2002, companies also sold to customers they were paying or lending to. Three cases are on the record.

WhoWhat they didHow it ended
QwestSold the right to use its fiber to companies that agreed to buy the same from Qwest, and counted the sales as revenue.The SEC said over $3.8 billion of revenue was wrongly booked from 1999 to 2002. Qwest paid $250 million without admitting it.
AOL Time WarnerGave other companies the money to buy its online ads, and reported the ads as sales.About $690 million of ad revenue was restated. It paid the SEC $300 million in 2005 without admitting wrongdoing.
Lucent, Nortel and CiscoLent customers the money to buy their equipment: $8.1 billion, $3.1 billion and $2.4 billion.The customers failed, and billions of the loans were written off.

Today's deals differ in one way that matters. They are disclosed, and the IMF can count them. The SEC said Qwest and AOL disguised theirs. What they share is the risk: a supplier's sales depend on money the supplier provided.

The 2008 comparison

Jennifer Harris, an economic official in the Biden White House, argued in The New York Times on October 25 that the closer match is the housing bubble. She draws four parallels: debt kept off balance sheets, which a Wall Street Journal analysis she cites put at $3 trillion for the nine largest tech companies; a small group buying and selling a hot product among themselves; loans landing with private lenders and the insurers they own; and auditors signing off. She names two differences. More American wealth now sits in AI-heavy stocks than in homes, and the government has less room to rescue anyone. Hers is an opinion essay, and I have not checked the Journal figure myself.

Sources: the SEC on Qwest and Time Warner; vendor loans (the amounts, Dow Jones on Lucent); Jennifer Harris in The New York Times

Fig. 20. The IMF's October 2026 Global Financial Stability Report reviewed 14 publicly disclosed deals since 2023, across the industry. My count on the previous slide covers the two labs only. The $450 billion is $1.4 trillion less $950 billion. The money went in from 2023 and the promises run into the 2030s, so it measures what the loop does not pay for, and it is not a debt. The IMF's Jason Wu called the spending promises the unusual part, "hence the circularity." Nvidia's $530.5 billion is the sum of three tables in its report for the quarter to July 26: $366 billion of commitments, $56 billion of additional commitments and $108.5 billion of guarantees. $279 billion of it is supply commitments, mostly to buy memory, and $164.5 billion supports customers' businesses and borrowing. The bank ranking is an estimate by Ryan Cummings of the Stanford Institute for Economic Policy Research, reported by The New York Times, which called Nvidia the "central bank of A.I." and also reports a $500 billion infrastructure fund Nvidia set up with Wall Street firms and a stake of more than 10% in CoreWeave. Sona mapped 176 deals among 202 companies to August 2026. Nvidia's guarantee pays out only if OpenAI defaults and the site cannot be let to someone else. Nvidia earned about $60 billion last quarter, so it could meet the guarantee in good times; it would be called when profits were falling. The 2.3 times is my arithmetic: the $164.5 billion that supports customers is reported as about 72% of Nvidia's shareholders' equity, which puts equity near $228 billion against $530.5 billion of promises. The IMF ranks a fall in AI shares as the top risk to markets. Three of the newest loops: Nvidia guarantees its customer's rent. In August it backed up to $105 billion of the lease on an Ohio data center that OpenAI will rent for 20 years. It owns $30 billion of OpenAI and sells the chips that go inside. Broadcom backs the loan that buys its chips. In October, four lenders put $63 billion into a company set up to buy Broadcom chips and lease them to Anthropic. Broadcom stands behind their resale value, up to $43 billion. The chips are leased, and the debt sits elsewhere. SpaceX signed a lease of about $40 billion for Nvidia chips the same week. The IMF finds $320 billion of the loans sitting with the companies that received the money.

Sources: the IMF's report (CNBC, The Next Web); Nvidia's guarantee; Broadcom's financing (the deal, its structure); Nvidia (The New York Times, its quarterly report, the customer share); Sona (Axios, Benzinga)

What happens if OpenAI grows only 40% a year?

OpenAI's spending plan only works if sales grow about 77% a year, and even then it needs $278 billion more from investors. At a still-fast 40%, here’s how the shortfall spreads. Every figure is my estimate.

Stipple drawing of an old cash register with its drawer open and empty

1Say OpenAI's sales grow 40% a year.

$160Bof sales in 2030. Its plan says $350B.

Over four years it takes in about $400 billion less than it planned on.

Stipple drawing of two server cabinets under dust sheets

2As a result, it can't pay Oracle.

$30Ba year, of the $60B it owes from 2027

It planned $856 billion of computing and can afford about half.

Stipple drawing of an idle crane hook

3As a result, Oracle and the cloud giants stop building.

−$100Ba year of building, an eighth of the total

Oracle brings in $32 billion of cash a year and owes $125 billion.

Stipple drawing of a computer chip

4As a result, the chip makers sell fewer chips.

−$40Ba year at Nvidia, a tenth of its sales

About 40 cents of each building dollar goes to Nvidia.

Stipple drawing of a coiled climbing rope with a broken strand

5As a result, the stocks fall together.

−10%for the S&P 500

I assume the AI-linked giants fall 30%. They are a third of the index ().

Stipple drawing of an auctioneer's gavel

6As a result, buyers stop paying for growth.

$550BOpenAI's worth at the market's ratio of 3.3, 56% less

At Google's price-to-sales ratio of 7 it is still worth about $1.2 trillion, before new shares ().

Stipple drawing of a shop with its shutter pulled down

7As a result, the economy slows.

About 1%growth next year, against 1.8% forecast

Less building and falling stocks take off most of a point ().

How I estimated each step

The arithmetic, step by step

These are rough sums meant to get the size right. The order of the steps matters more than any one figure.

StepThe sumWhat I assumed
1. SalesOpenAI sells at a pace of about $50 billion a year today. Growing 40% a year, the pace is $70 billion at the end of 2027, then $98 billion, $137 billion and $192 billion at the end of 2030. A calendar year's sales sit between two year-ends: about $59 billion, $83 billion, $116 billion and $162 billion, or $420 billion in all. Its plan has $840 billion for 2026 to 2030 with $36 billion this year, so $804 billion for the same four years. The gap is $384 billion.The starting pace. About $50 billion a year is what OpenAI told investors for the end of September, as the Financial Times and Bloomberg reported, and it booked about $10 billion of sales in the third quarter. A figure near $70 billion, reported by Axios, was investors counting OpenAI's sales the way Anthropic counts its own; $70 billion is also OpenAI's target for the end of 2026. Starting from $70 billion would cut the gap to about $220 billion. Starting from the plan's own $36 billion makes it about $450 billion. The plan's growth, $36 billion to $350 billion in four years, is 77% a year.
2. OracleThe plan spends $856 billion on computing through 2030 and burns $278 billion of investors' money. Take $384 billion out of sales and computing falls to about $470 billion, 45% less. Oracle's contract is $300 billion over five years from 2027, about $60 billion a year.Investors still put in the $278 billion and no more, other costs hold, and every supplier takes the same cut. I round 45% to half.
3. BuildingIn its last fiscal year Oracle had sales of $67 billion, cash from operations of $32 billion, and spent $56 billion on data centers. OpenAI is more than half of its $638 billion of signed contracts. $384 billion over four years is about $100 billion a year of lost rent, shared among Oracle, Microsoft, Amazon and smaller landlords. The four cloud giants budgeted $730 billion this year and Oracle about $70 billion.Each $1 a year of lost rent cancels $1 a year of building. A check: a gigawatt costs about $49 billion to build, so 7 or 8 unneeded gigawatts are about $370 billion of building, spread over three to four years.
4. ChipsJensen Huang put Nvidia's share of the large cloud companies' spending at about 40%. Nvidia sold $96 billion last quarter and expects $108 billion this quarter, a pace of about $400 billion a year. $40 billion is a tenth.Nvidia's share holds, and other customers do not cut. If they read OpenAI as a sign about all demand, the cut is larger.
5. StocksA third of the index falling 30% takes about 10% off the whole.The 30% is the fall I use for the AI-linked giants in my AI bust case. It is a judgment.
6. The price-to-sales ratio$50 billion growing 40% a year for five years is $269 billion. At 7 times sales that is $1.88 trillion, worth $1.17 trillion today if buyers want 10% a year. At 3.3 times it is $887 billion, worth $551 billion today.The same formula as my scenarios: price is sales times the price-to-sales ratio.
7. The economy$100 billion is about a third of 1% of a $31 trillion economy. AI stock gains of $7.6 trillion add about half a point to spending, and a 30% fall would undo most of them.The economy's size is my round number.

Three things could stop the chain at step 2. Investors could put in the missing $400 billion, though the largest round so far was $122 billion. Suppliers could accept later payment. OpenAI could cut its other costs. My correction case assumes some of each, which is why it ends in a correction.

Sources: OpenAI's plan (the Financial Times, via DealStreetAsia); OpenAI's sales pace and third quarter; the $70 billion figure; PitchBook on the Oracle contract, via Fast Company; Oracle's year (sales, cash flow, spending, contracts); Nvidia (results, share of spending); Morgan Stanley on building costs; my arithmetic

What happens if OpenAI can't pay the rent? Step by step

One contract, followed to the end

OpenAI has leased a data center campus in Ohio for 20 years. A developer, SB Energy, is building it with borrowed money, and Nvidia has guaranteed part of the rent and power bills, up to $105 billion.

StepWhat happensWho takes the loss
1. Sales fall shortOpenAI's customers buy less than it planned for. It needs less computing and cannot cover the rent.OpenAI and its shareholders, Nvidia among them with $30 billion.
2. The lease failsThe developer borrowed against 20 years of rent. Its lenders turn to the guarantee.Nvidia, for up to $105 billion, unless another tenant takes the site. In a slump, other tenants are short of demand too.
3. Orders stopOpenAI stops buying chips for the site. Sales Nvidia had counted on do not happen.Nvidia again, and its own suppliers. It has promised to buy $279 billion of parts.
4. The backer weakensNvidia's shares and credit fall. It also backs loans to CoreWeave and others, and their lenders now ask for more.Every company that borrowed on Nvidia's word. CoreWeave already pays about 11.5% a year to insure its debt.
5. The loop reversesFewer data centers get financed, chip orders fall again, and the labs' partners have less to invest in the labs.The same few companies, a second time.

Why the swings are bigger: in an ordinary supply chain, a failed customer costs a supplier its sales. Here it costs the sales, the investment and the guarantee together, and it weakens the lender everyone else leans on. The money that looked like demand on the way up becomes a debt on the way down.

Sources: Nvidia's guarantees and supply commitments; commitments against shareholders' equity; the cost of insuring CoreWeave's debt; The New York Times on Nvidia's stake in CoreWeave

Part 4

Too Much Stock

Even if the growth arrives, there may not be enough buyers for all the stock coming to market. Over the next two years, $4.3 trillion of shares become sellable, and I expect about $1 trillion of it to actually be sold. The question is who buys it.

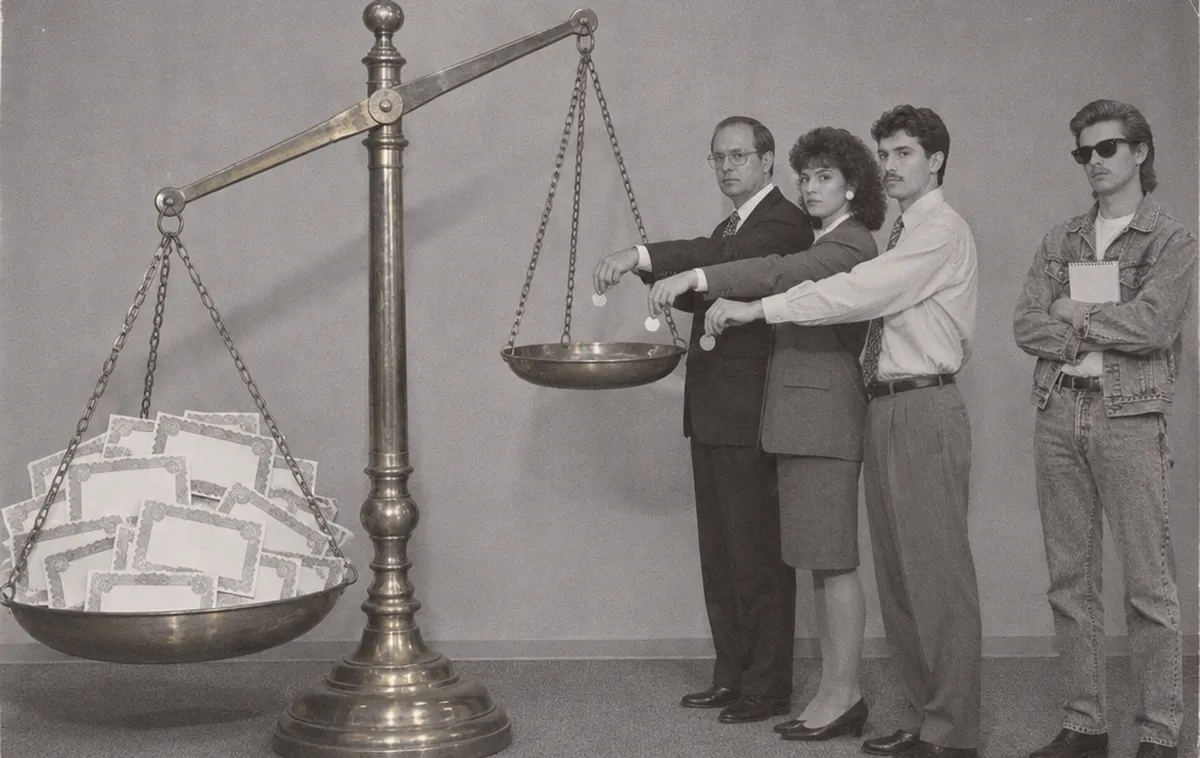
Photo of a balance scale tipped by a heap of paper certificates on one side, while three people add coins to the other

At today's valuations, how much stock will come up for sale?

About $1.02 trillion from June 2026 through May 2028. To estimate it, I made assumptions about what percentage insiders will sell, and about any forced selling by investors who borrowed.

Supply: stock coming up for sale

Unlocked stock that insiders sell

20%
Middle of the evidence

After past IPOs, venture funds sold about a quarter of their stakes in the first year.

Each extra point sold widens the gap by about $27 billion.

0%10%20%30%Musk, 0%Venture fundsin the past, 26%I use 20%for everyone else

After past IPOs, venture funds sold about a quarter of their stakes in the first year. Staff sell less, and founders in control rarely sell. Each extra point they sell widens the gap by about $27 billion.

Share of Elon Musk's stake sold

None
One person decides

His SpaceX stake, $858 billion, is counted apart because one person decides.

Each point he sells widens the gap by about $6 billion.

His stake, $858BEveryone else, $2.99TStock that unlocks by May 2028

His SpaceX stake is counted apart because one person decides. I assume he sells none of it. Each point he sells widens the gap by about $6 billion.

Forced selling from borrowed money

None
Assumes no trouble

Investors owe a record $1.5 trillion against their stocks, up 49% in a year.

Every $100 billion forced out widens the gap by about $75 billion.

$1.01TJune 2025$1.50TJune 2026$0I use$150BAI bust case

Investors owe a record $1.5 trillion against their stocks, up 49% in a year. My best guess forces none of it out. Every $100 billion forced out widens the gap by about $75 billion.

Fig. 21. The three settings behind the supply side of Fig. 24 and the history each rests on. New stock is what the six companies sell to raise money. The venture figure is my arithmetic from Field and Hanka's study of IPOs from 1988 to 1997: 6 points sold of a 23-point holding. The standard study of 1,948 IPOs found venture funds cut their holdings from 23% of a company to 17% in the first year. Borrowed money is FINRA's count of margin debt; in July it fell $85 billion in one month, the largest drop on record, with the market flat. The AI bust case forces out $150 billion, a tenth of it. The model cannot see loans against insiders' shares or data center debt kept off the books.

Sources: insider selling (Field and Hanka, summary); margin debt (FINRA, July's drop)

How much money will there be available to buy it?

If today’s flows hold, roughly $530 billion, well short of the $1 trillion for sale. It comes from four places: new money flowing into stock funds, index funds buying each company once it joins the index, big strategic buyers, and cash moving out of money-market funds. These flows could rise or fall depending on which scenario plays out, and Part 5 takes that up.

Demand: money available to buy it

New money into stock funds

$100B a month
Leans toward the buyers

ETFs took in a record $1.5 trillion in 2025. The five-year average is $80 billion a month.

Each extra $10 billion a month narrows the gap by about $23 billion.

$77B2021$50B2022$50B2023$98B2024$125B2025I use

ETFs took in a record $1.5 trillion in 2025. I use $100 billion a month, above the five-year average of $80 billion. Each extra $10 billion a month narrows the gap by about $23 billion.

Share of it going to AI stocks

12%
Leans toward the buyers

The six are 12.8% of the market, but only about 8% can be bought today.

Each extra point narrows the gap by about $27 billion.

7 to Google, Metaand Oracle5 to SpaceX,Anthropic, OpenAI88 to everything else

Funds buy the market by size, and the six are 12.8% of it. Only about 8% can be bought today, because so little of SpaceX trades. Each extra point narrows the gap by about $27 billion.

The other buyers

$229B
Smaller and steadier

Index funds $123 billion, strategic buyers $76 billion, money-market cash $30 billion.

Index funds buy only once a company joins the S&P 500, about a year after it lists.

$123BIndex funds$76BStrategic buyers$30BMoney-market cash

Index funds buy about a quarter of each share that comes free, but most wait until a company joins the S&P 500, a year after it lists. Seven companies are buying $26 billion of Anthropic at its IPO. I assume 2% of the $8 trillion in money-market funds moves into stocks in a year.

Fig. 22. The settings behind the demand side of Fig. 24 and the history each rests on. On the first two I lean toward the buyers, so the true gap is more likely to be larger than smaller. Fund flows are yearly net inflows to all US-listed ETFs, divided by twelve; they include bond funds, which also flatters the buyers. Older mutual funds lose money every year, which the fund figure leaves out. The market share uses full company values; the 8% is my estimate of the part that trades today. Company buybacks, over $1 trillion a year, buy none of this stock. Berkshire also put $10 billion into Google.

Sources: fund flows (ETFGI, etf.com); US market value

How big is the gap?

If today’s flows hold, about $494 billion short.

From June 2026 to May 2028, about $1 trillion of stock comes up for sale, against roughly $530 billion likely to buy it if current inflows hold. When there’s more stock than buyers, prices fall until the gap closes. Part 6 works out how far that could push prices down.

Fig. 23. Stock for sale and the money likely to buy it, added up from June 2026 through May 2028, from the model on the next slide, if today’s flows hold. About $3 trillion a year flows into US stocks, but most investors buy the whole market, and these six are about 12 cents of every dollar in it. Company buybacks, over $1 trillion a year, buy none of this stock. Index funds buy a slice of every share that comes free once a company joins an index, so much of the stock lands in ordinary retirement savings. S&P 500 funds wait for inclusion, a year after listing: June 2027 for SpaceX and November 2027 for Anthropic, and OpenAI not before 2028. Until then I assume only total-market and Nasdaq-100 funds buy, about 8 cents of each dollar.

Sources: ETF flows; Goldman on buybacks; money-market assets; Kansas City Fed; index and strategic figures are my estimates

What if the assumptions change?

Move the sliders to test your own: how much insiders sell, and how much money flows in. Selling minus buying is the gap.

Supply: stock coming up for sale
20%

Staff and early investors become free to sell about $3 trillion of stock. Each extra point they sell widens the gap by about $27 billion.

0%

His SpaceX stake, about $860 billion, is counted apart because one person decides. Each point sold widens the gap by about $6 billion.

None

Investors who borrowed against their stock and must sell when it falls. Every $100 billion widens the gap by about $75 billion.

Demand: money available to buy it
$100B

What savers add to US stock funds. Each extra $10 billion a month narrows the gap by about $23 billion.

12%

The part of that money that reaches these six companies. Each extra point narrows the gap by about $27 billion.

Selling minus buying is the gap. Each scenario in runs its own settings, and turns the gap into a price.

Selling–
Buying–
Gap–
Fig. 24. Added up month by month, June 2026 to May 2028. The dashed line is expected selling: new stock, plus the share of unlocked stock that insiders sell. The bars are natural buying, by source. The space between them is the gap. The first four sliders count only people who choose to sell or buy, and the last adds forced sellers. Each scenario in Fig. 28 uses its own settings of these sliders. These are rough guesses.
New fund moneyIndex fundsMoney-market cashStrategic buyers

Source: my model. Price pressure assumes $2 of lost value for each $1 of net selling.

What could the price do while the stock unlocks?

About 8 to 10% at today’s prices, from the gap alone, if each $1 of net selling takes $2 off the value of the six companies. It is a push on prices while the stock unlocks, not a change in what the businesses are worth, so I keep it out of fair value ().

This is an extrapolation. The $2 comes from studies of flows far smaller than $494 billion. At $1 the fall is 4%, and at $5 it is 13%.

How I arrived at $2 · the research

How I arrived at $2

  1. Over two years, if today's flows hold, I expect $1.02 trillion of selling and $526 billion of buying. The gap is $494 billion, or 4.9% of the six companies' $10 trillion value.
  2. Economists measure how far a gap like that moves prices as the dollars of market value that move when $1 of stock is bought or sold with no news behind it.
  3. I use $2. A lower price also shrinks the selling and draws in buyers, so the gap closes at about an 8% fall.

What the studies found

Six studies, in dollars of value moved per $1 of net selling: Pavlova and Sikorskaya (30 to 50 cents per $1), Zou and Ye ($1.00 to $1.40), Lou ($1.20), Li and Lin ($1.73), Hartzmark and Solomon ($1.90) and Gabaix and Koijen ($3 to $8).

Study
What it watched
$0$2$5$8
Value moved per $1
Fall it implies here
Single stocks moving between index funds' benchmarks
$0.30 to $0.50
2%
Zou and Yeworking paper
A randomized change in the supply of single stocks
$1.00 to $1.40
4% to 6%
Lou2012
Mutual funds forced to trade single stocks
$1.20
5%
Li and Linworking paper
Order flow in single stocks. Larger for groups of stocks
$1.73
7%
Hartzmark and SolomonAmerican Economic Review, 2025
Dividends reinvested across the whole market, on dates known weeks ahead
$1.90
7%
My assumptionthis deck
Six companies worth $10 trillion, two years of selling
$2
8%
Gabaix and Koijenworking paper
Money moving into and out of the whole market
$5, range $3 to $8
13%, range 10% to 16%

A 2026 conference review of this research put the usual figure for single stocks at about $2. Textbook models put it near 5 to 10 cents.

What happened at past lockups and large IPOs

Lockups. Field and Hanka (Journal of Finance, 2001) studied 1,948 lockups. Prices fell 1.5% in the three days around the expiry and did not rebound, though the date had been public for months. The fall was larger when venture capital funds held the stock.

Large IPOs. Braun and Larrain (Review of Financial Studies, 2009) studied 254 IPOs in emerging markets. A large listing permanently lowered the prices of similar stocks. They doubt one IPO could move a large developed market.

Why the size is loose

Scale. Every study uses flows far smaller than $494 billion. A working paper by Chaudhry and Li argues that each dollar moves prices less as the flow grows.

Breadth. Six companies are more than one stock and less than the whole market. Li and Lin find the effect grows with the breadth of the selling, which is why I sit between $1 and $5.

Time. One working paper estimates the effect starts near $4.50 and fades toward $1 as slower investors step in.

Method. Van Binsbergen, David and Opp argue the standard methods are biased and that markets absorb selling far better than these figures say.

Most of the evidence points one way: more stock for sale means lower prices. The size is loose. My model gives a 4% fall at $1, 8% at $2 and 13% at $5.

Slide the price down. The lines meet at the likely landing spot.

0%
Gap left–
Closes at about–
Fig. 25. Expected selling and total buying at each price drop, June 2026 to May 2028. Buying includes fund managers swapping in money, at $1 for every $2 of lost value. The research behind the $2 is in the note beside the chart. Where the 8% comes from: the $494 billion gap is 4.9% of the six companies' $10 trillion value. I assume each $1 of net selling takes $2 off that value, which makes about 10%. Buyers drawn in by the lower price bring it back to about 8%. The $2 sits beside the best published estimate for selling known in advance, $1.90. Other studies run from $1 to $5, which puts the fall anywhere from 4% to 13%. There is a lot of slop in the size. The direction is clear.

Source: my model.

Isn't this all already priced in?

Mostly, but today’s price is set by the most eager buyers, because so little of the stock can trade yet. The real test comes when the rest can be sold.

From the IPO price to the day before the unlockOn the dayTesla2010+77%−15.1%Google2005+120%+3%Snowflake2021+108%−3.7%Facebook2012−48%+12.6%Alibaba2015−3%−2.8%Snap2017−30%+6.5%Uber2019−38%−3.9%Lyft2019−27%−1.5%Rivian2022−63%−20% over two daysSpaceX2026−20%+6.1%
How ten earlier unlocks went

The largest unlock at eleven companies

Company and dateWhat unlockedPrice, IPO to the day before, then on the day
Amazon, Nov 1997About 19 million shares, most of the company, about 180 days after the IPO.Up roughly 180% before. Daily prices from 1997 are too coarse to show the day.
Google, Feb 14, 2005About 177 million shares, the last and largest release, triple the shares trading.Up 120% before. Up 3.0% on the day.
Tesla, Dec 27, 2010About 75 million shares, roughly quadrupling the shares trading.Up 77% before. Down 15.1% on the day.
Facebook, Nov 14, 2012804 million shares, almost doubling the number trading.Down 48% before. Up 12.6% on the day.
Alibaba, Sep 21, 2015Nearly 1.6 billion shares, 63% of the company, worth about $105 billion.Down 3% before, and 30% from its first day's close. Down 2.8% on the day.
Snap, Aug 14, 2017About 800 million employee shares.Down 30% before, after weak results. Up 6.5% on the day.
Uber, Nov 6, 2019About 1 billion of its 1.7 billion shares.Down 38% before. Down 3.9% on the day, to a record low.
Lyft, Aug 19, 2019About 258 million shares, 88% of the company.Down 27% before. Down 1.5% on the day.
Rivian, May 9, 2022About 800 million shares. Ford sold 8 million at once.Down about 63% before. Down more than 20% over the next two days.
Snowflake, Mar 5, 2021The final release, about 345 million shares, ten times the shares trading.Up 108% before. Down 3.7% on the day.
SpaceX, Aug 6, 2026911.5 million shares, which raised the number trading by 143%.Down 20% before, and 33% from its first day's close. Up 6.1% on the day.

Where the stock fell, most of the fall came before the date. On the day itself, seven of ten moved less than 7% either way. Each also had news of its own in that stretch, so this shows the pattern and not the cause. Facebook went on to quadruple within three years of its largest unlock.

Sources: Google (CNN, the day); Tesla (Bloomberg, shares); Snap (Reuters); Lyft (CNBC, prices); Snowflake (the date, shares, prices); Amazon (S-1); Facebook (Bloomberg, the fall before); Alibaba (Bloomberg, the shares); Uber (CNBC, the close); Rivian (CNN, Axios); SpaceX

Fig. 26. The 1,948 lockups are Field and Hanka's sample for 1988 to 1997. Ofek and Richardson measured internet stocks from 1998 to 2000. The later study is Paul Schultz's, which found internet stocks lost 58% in five weeks of March and April 2000 whatever their lockup status. The comparison divides each amount by the S&P 500's total value: $12.3 trillion at the end of 1999 and $68.6 trillion on November 13, 2026. The dot-com IPO figures cover every American IPO, and the unlocked-share figure covers internet companies only, so the two eras are not measured on the same set of companies. My $298 billion counts Anthropic's IPO this week. Facebook's 48% is from its $38 IPO price to $19.86. SpaceX's 20% is from its $135 IPO price to about $108.

Sources: Field and Hanka; Ofek and Richardson; Schultz; the unlocked-share totals; Jay Ritter's IPO tables; S&P 500 value by year

What happened the last time this much stock unlocked at once?

In 2000, a wave of unlocks this size arrived right at the market’s peak, and internet stocks fell 58% in two months. Today’s wave runs at about the same monthly pace and lasts three times as long.

0.5%0.5%1.0%1.0%1.5%1.5%Then: internet stocks, 1998 to 2000$201 billion unlocked from November 1999 to April 2000, 1.6% of the S&P 500's valueNow: SpaceX, Anthropic and OpenAI$3.3 trillion to unlock by May 2028, 4.8%Jan 1998Jan 1999Jan 2000Dec 20004008001,200Internet stocks peak in March 2000at ten times their level of two years beforeDown 58%in two monthsIndex of internet stocksDecember 1997 = 100, right scalecount ends Aug 2000Elon Musk's stake, $858BI assume he sells noneNov 2026Jun 2027Jan 2028TodayBars show stock unlocked each month, as a share of the S&P 500's total value. Both panels use the same scale.

This doesn’t prove the unlocks caused the crash. A later study found internet stocks fell just as hard whether or not their lockups had ended. But it shows a wave like this can arrive right at the top.

Fig. 27. Left: the dollar value of shares released from lockup each month at 327 internet companies, January 1998 to August 2000, and an equally weighted index of internet stocks through December 2000, from Eli Ofek and Matthew Richardson. The paper prints these as charts without the numbers, so I read each bar and the index line off the charts: the bars are good to about half a billion dollars, and they add up to $293 billion against the paper's "almost $300 billion." The paper puts the index near 1,030 on March 1, 2000 and 430 by the end of April. Right: the lockup schedule from , added up by month, at $134 a share for SpaceX and $74 for Anthropic, with my forecast for OpenAI. Each bar is divided by the S&P 500's total value, $12.3 trillion at the end of 1999 and $68.6 trillion on November 13, 2026. The later study is Paul Schultz's.

Sources: Ofek and Richardson, "DotCom Mania," Journal of Finance, 2003; my lockup schedule

Part 5

Five Ways It Plays Out

I think this handoff could play out five ways, from an AI acceleration to a full-blown recession. The most likely, at 35%, is an AI bust. What separates them is mainly how fast the labs’ sales grow, and that comes down to how fast people adopt AI.

AI acceleration5% chanceSmooth handoff10% chanceAI correction25% chanceAI bust35% chanceEconomic recession25% chance
Photo of a woman at a country crossroads facing a signpost with five blank arrows, sun over a city on one side and a storm on the other

How could this play out?

This could play out five ways: an AI acceleration, a smooth handoff, a correction, a bust, or a recession. Each case answers two questions differently: how fast the labs’ sales grow, and what investors are willing to pay for each dollar of them. Tap a case to see more details.

Fig. 28. Rough moves in stock prices in each scenario. For the AI-linked giants, the S&P 500 and the Nasdaq-100 they include the squeeze from new stock; AI-linked companies are about a third of the S&P 500 and about half of the Nasdaq-100, where Nvidia, Alphabet, Microsoft, Amazon, Meta and Broadcom alone were 32% in March, before SpaceX and the other chip makers joined or grew. for the two labs, fair value leaves it out. Selling and buying are two-year totals from the model in Fig. 24, set for each scenario: insiders sell 20% of unlocked stock in the AI correction, 35% in the AI bust, 12% in the smooth handoff, 8% in the acceleration and 40% in the recession, and the AI bust and recession add $150 billion and $250 billion of forced selling. The correction and smooth cases follow published valuations of Anthropic. The AI bust follows the chain posted by Masa's Son, who has the cloud giants down 30 to 50%; the exact numbers are my reading of it. The numbers for the AI-linked giants before the squeeze (a 25% gain, then 0, 5, 30 and 45 percent) are my judgment. The S&P 500 number is their fall times their 35% share of the index, with every other stock held flat, except in the recession. There I assume the rest of the index falls 30%, which takes the S&P 500 down about 40%. That is close to where the index would be if its price-to-earnings ratio fell from 26 to its long-run average of 16, a drop of 37%. A return to the average on ten-year profits would be 56%, and the index fell 49% in 2000 to 2002 and 57% in 2007 to 2009, so 40% is not the worst case. Steve Eisman's odds are 30 smooth, 40 correction and 30 crash. Mine put less on a smooth handoff and a correction, because parts of the bear's chain have already happened, and more on a bust and a recession, because of the three weak points on . I keep 5% for an acceleration that beats the labs' own plans, a case his odds leave out. The recession case is the bust with sales flat and the losses reaching lenders. Revenue moves prices twice: it sets what the companies are worth, and it decides how many buyers show up for the new stock. Every case allows for new shares: OpenAI's plan needs $278 billion more from investors by 2030, which at today's price is about a tenth more shares across the two labs. Weighted by my odds, the labs’ fair value comes out about below today’s price; the squeeze from new stock is shown separately, as a temporary push on prices.

Sources: Nasdaq-100 weights; Pew, smartphone ownership; Morningstar; Aswath Damodaran; New Constructs; Steve Eisman; my model

How likely is each?

Each case is a different set of the seven tests passed and failed (, ). Today the labs clearly pass two, which looks most like a bust. The odds are my judgment, not math.

How I set the odds

Three questions, in order

How fast do the labs’ sales grow? Faster than their own plans, 5%, is an AI acceleration. 40% a year or more, 10%, is a smooth handoff. That leaves 85% where sales fall short.

If sales fall short, do the labs still get paid? I give that about one chance in three, which is the AI correction, 25%. Otherwise open models or Google take the money.

Do the losses spread through lenders? If not, about 60% of what is left, it is an AI bust, 35%. If they do, it is a recession, 25%.

Part 6

What They’re Actually Worth

To pay today’s prices, you’d have to believe these companies grow faster than any company ever has. Weighting each scenario by its odds, I estimate they’re worth about of what’s being asked. Here’s the deliberately simple methodology I used, and where I think it’s weakest.

Photo of a smiling robot showing a rising chart in an annual report to a startled businessman who holds out an empty coin purse

How do you value a company with no profits?

Any view on what these companies are worth needs a basis. Neither lab makes a steady profit yet, so you have to work with what exists: sales today, how fast those sales grow, and what investors will pay for each dollar of them. Here’s how they fit together.

Fair value = S × (1 + g)5 × P/S ÷ (1 + r)5 × k

SSales today

What the labs sell in a year: $118 billion ().

gGrowth rate

How fast those sales grow for five years. Each scenario sets its own ().

P/SPrice-to-sales ratio

What investors pay for each dollar of sales in 2031 ().

rRequired return

Money in 2031 is worth less today. I use 10% a year, about what stocks have returned over the long run ().

kShare holders keep

About nine tenths, after the new shares the labs still have to sell ().

The squeeze from too much stock for sale () is left out on purpose. It moves the price while the stock unlocks, not what the business is worth. This is a deeply imperfect exercise. It leaves much to debate and a great deal that nobody can know yet. That is the nature of companies this young.

Why price-to-sales, and not the other methods?

Neither lab makes a steady profit yet, so there are no earnings to value. Sales are reported and easy to compare. And it keeps the argument to three numbers anyone can check and dispute.

MethodWhy it does or doesn’t fitWhat it gives here
Price-to-salesThe one I use. Neither lab has steady profits, and sales are reported and easy to compare.About $200 billion to $10.6 trillion for the two labs, across my five scenarios ()
Discounted cash flow (DCF)Nearly all the value sits in guesses about the 2030s.Published DCFs of Anthropic alone run from $144 billion to $1.7 trillion
Price-to-earningsNeeds steady earnings. There are none yet.No answer: both labs lose money, so the ratio is meaningless
Last price paidThe private round or the IPO range is the price being tested.About $2.55 trillion, the asking price itself, so it is circular
Market size (TAM, SAM, SOM)One guess stacked on another.Bloomberg Intelligence puts all spending on generative AI at $2.3 trillion a year by 2032. That counts hardware, software and services, not just what the labs earn. A big enough market can justify almost any price

Source: Bloomberg Intelligence's market estimate

A worked example: try your own inputs

The formula, one line at a time. It starts on my AI correction case: sales grow 35% a year and investors pay about $7 for each $1 of sales, like Google today. Move the sliders, or load a scenario.

Each input is debatable, and the next slide shows where I could be wrong. k, the share today’s holders keep, stays at about nine tenths.

My verdict, weighted by my odds

About too expensive.

$2.55 trillion

What the two labs are worth, weighted by my odds
$1.52T
The price being asked
$2.55T

To pay the full price, you have to believe in faster growth, a durably higher price-to-sales ratio, or both. A ratio that holds up would break the pattern of every major tech IPO since 1997: all nine that listed with real sales saw their ratio fall within five years ().

Each case ()

Where I could be wrong

Four places a banker or a trader would push hardest, and what I did about each.

A ratio of 7 assumes the labs become about as profitable as Google.

28%
The after-tax margin a ratio of 7 needs
Profit margin, after taxRatio at 25 times earnings
Anthropic today, about 12%3
Anthropic's long-run target, about 28%7
Google today, 33%8

A price-to-sales ratio is a profit margin times a price-to-earnings ratio. OpenAI is nowhere near: it loses about a dollar for each dollar it sells. A banker could push the other way: a lab still growing 35% in 2031 may deserve more than 7.

10% is probably too low a return for stocks this risky.

10%
A year, what I assume buyers want
If buyers wantThe correction case looks
10% a year19% too expensive
12% a year26% too expensive
15% a year35% too expensive

10% is roughly what the whole stock market has returned over the long run. Buyers of young, money-losing companies usually want more, so if anything this flatters the labs.

The two labs count sales differently.

$118B or $138B
Their combined pace, two ways
Counting OpenAI's salesThe correction case looks
Its own way, $50 billion19% too expensive
Anthropic's way, about $70 billion5% too expensive

Anthropic counts what its cloud partners sell. OpenAI counts only its own share. I use OpenAI's own figure.

New shares thin out today's holders.

$278B
What OpenAI's plan still needs from investors
New shares, sold at today's priceHolders keep
OpenAI alone, 22% more shares82%
The two labs together, 11% more90%

Counted in every case. It is a floor: if prices fall, OpenAI must sell more shares to raise the same money. On the other side, Anthropic holds $131.7 billion of cash, which a banker would add back.

Weighted by my odds, with all of this counted, the labs come out about lower than today’s price ().

Fig. 29. The margin arithmetic is price-to-sales equals profit margin times price-to-earnings. Anthropic told investors on its roadshow that its adjusted operating margin was 15% in the third quarter and could pass 35% in the long run, without a date; I take off 21% for tax to get about 12% and 28%. Google's net margin was 32.8% in 2025 and it trades at about 22 times earnings and 8 times sales, so the 7 I use for it is a little low. A ratio of 7 says the labs reach the margin Anthropic is aiming for, with no date set; if the models become a commodity, neither gets there. Money in 2031 is worth less than money today, and 10% is about what stocks have returned over the long run; all three rows of the return table are before selling pressure. Counted Anthropic's way the pair sell about a sixth more, and most of my base-case gap closes. Staff stock awards add to the new shares, and Anthropic holds $132 billion of cash and is raising $85 billion more at its IPO, so I assume it sells no more. OpenAI's adjusted operating loss was about $10.9 billion in the third quarter on about $10 billion of sales, and its gross margin was 33% in 2025 against a target above 60% by 2030. The return table reruns the AI correction case, $3.7 trillion of value in 2031, at each rate and after new shares. On sales, TechCrunch reports that Anthropic counts sales made by its cloud partners while OpenAI reports only its share; the $70 billion is what OpenAI's investors got when they restated it Anthropic's way. Google also reports its sales before paying its partners, so the fuller count may be the fairer match for its ratio. The $278 billion is the cash OpenAI's plan burns from 2026 through 2030. A trader would add five more. Anthropic’s $1.3 trillion counts every option and grant; on shares actually outstanding it is less, and one basis should run throughout. OpenAI’s long computing leases act like debt, which would lower fair value. Both labs pay staff heavily in stock, which dilutes holders every year beyond the $278 billion. The model stops at 2031, so a lab still growing fast then is worth more than seven times sales. And annualizing the latest quarter flatters fast growers against trailing twelve-month sales.

Part 7

What It Means for Everyone Else

Stock prices are only part of it. AI spending now drives a large share of US growth, so a fall in these stocks reaches jobs, savings and lenders. Here are the dates to watch, and what it would take to turn an AI bust into a recession.

Photo of factory workers and two robots standing in a row behind tables of boxes, under a banner for a 1994 annual report

What would this mean for the economy?

Last quarter's 3.4% flatters the starting point. One forecaster expects 1.8% next year, so an AI bust, my most likely case, leaves little cushion. It becomes a deep recession if the losses spread through debt.

Stipple drawing of a sprinter thrusting a relay baton forward5%chanceBest caseAI acceleration
Plans rise faster: +$300B a year, +1.0 point
Stocks +9%: +$6.2T of wealth, +$120B of spending, +0.4 point
Paid early
About 3.2%, a boom
Stipple drawing of one hand passing a relay baton to another10%chanceGood caseSmooth handoff
As announced, no change
Stocks flat, no change
Paid
About 1.8%, as forecast
Stipple drawing of a relay baton slipping between two hands25%chanceMiddle caseAI correction
Plans hold, no change
Stocks −5%: −$3.4T of wealth, −$70B of spending, −0.2 point
Paid
About 1.6%
Stipple drawing of a dropped relay baton on the ground35%chanceBase caseAI bust
The cloud giants cut 2027 plans: −$340B a year, −1.1 points
Stocks −16%: −$11T of wealth, −$220B of spending, −0.7 point
Oracle needs a rescue; $125B of its debt at risk
About zero, a stall
Stipple drawing of a broken relay baton in the rain25%chanceWorst caseEconomic recession
Building stops, data centers unfinished: −$500B a year, −1.6 points
Stocks −41%: −$28T of wealth, −$560B of spending, −1.8 points
Losses spread through the $800B private lenders put in
Below −1.6%, before credit losses

Fig. 30. The US grew 3.4% at a yearly rate in the third quarter of 2026. Spending on computers, equipment and software added about 1.1 points of that, so without it the economy still grew more than 2%. Stocks are a record 48% of Americans’ savings, and the richest tenth own 88% of them, so the wealth effect runs mostly through the households that do the most spending. S&P 500 funds wait about a year to add a new listing, so most savers will own SpaceX and Anthropic only later; Nasdaq-100 funds added SpaceX in 15 days. The growth column starts from Continuum Economics' forecast of 1.8% for 2027, with 1.2% in the first half, and adds two effects. The building: one point of growth is about $310 billion in a $31 trillion economy; the changes in building are my assumptions for each case. Household wealth: the $7.6 trillion of AI stock gains added about half a point, about 2 cents of spending for each dollar of wealth. I apply the same 2 cents to each case's move in the S&P 500, whose stocks were worth $68.6 trillion on November 13. The debt is not converted to growth; in a recession, credit losses come on top. It is rough arithmetic and my judgment, and it is not a forecast.

Sources: Continuum Economics' forecast; Bank of America, via Yahoo Finance; ING; Peterson Institute; Capital Economics, via CBS; Morgan Stanley estimates; rates (CNBC, Axios); breach (TechCrunch, BleepingComputer); export controls (Congressional Research Service, Al Jazeera); my model

Has the bear case already begun?

In small ways, yes. None of these is in my scenarios’ math, but any could turn a slow decline into a fast one. Each is small on its own. Together they’re why I don’t give the smooth handoff more than 10%.

Nvidia

−31%

Jensen Huang resigned as chief on November 12. The stock is about 31% below its October high.

Interest rates

5%+

The 10-year Treasury yields over 5%, and the Fed is raising rates, not cutting. If money into stock funds fell from $100 billion a month to $60 billion, the gap would widen by $90 billion.

Government

2 weeks

In June, export controls switched off Anthropic’s two newest models. Washington now wants Nvidia held to a bank’s standard of compliance.

Security

1 breach

This month hackers took customer chats from Fireworks AI. A breach at a lab would give businesses a reason to pause, or to run their own models.

Credit

2.9%

A record cost to insure Oracle’s debt, a year. In July, borrowed money in stock accounts fell $85 billion, the largest one-month drop on record.

How far prices have already fallen, at the close on November 13

Fig. 31. Recent signs that the bear case has started. Nvidia: its founder and chief resigned on November 12, and the stock closed at $162.85, about 31% below its October 6 high. The cost of insuring Oracle’s debt is from its credit default swaps, 290 points, a record. Margin debt is FINRA’s count. The falls are measured at the close on Friday, November 13, 2026.

What turns an AI bust into a recession?

Four reasons I give a recession a 25% chance. Each makes the economy more fragile than last quarter's growth suggests.

The spending sits at the top.

46 to 50%
of spending comes from the top tenth of earners

The spending follows the stock market. The S&P 500 has nearly doubled since the end of 2022, and the wealthiest tenth own 88% of all stocks. If the market falls, so does their spending.

1990200020102020Share of all household wealthRecessionWealthiest tenth, 69%61% in 1989Bottom half, 2%3%

Private credit is already strained.

6.3%
of 1,200 US companies that borrowed from private credit funds defaulted in the past year (Fitch Ratings)

Private credit funds lend directly to mid-sized companies, in place of banks. Their money comes largely from life insurers, which keep nearly a third of their $5.6 trillion there, and from banks, which have lent the funds about $300 billion.

5%6%4%Fitch U.S. private credit default rateDec 2024Dec 2025Sep 20266.3%, a record4.6%

What turns an AI bust into a recession? Continued.

Two more reasons the economy is more fragile than it looks.

The Fed has little room.

3.7%
inflation in September, and the Fed raised rates that month

In each of the last four recessions the Fed cut rates fast. With prices rising this quickly it cannot ().

1990200020102020InflationThe Fed's rateRecession8% in 20222% target3.7%nowFed 3.9%

Growth leans on the AI buildout.

About half
of US growth since the start of 2025 came from AI spending (EY-Parthenon)

Data centers, chips, software and the power to run them. ING counts a third. Either way, if the building stops, a large part of growth stops with it.

1 pt2 ptPoints of GDP growth from AI spending1.3Q1 20251.30.6~11.6Q1 2026Q3not itemizedAverage 1.1, about half of growth

What cuts the other way: employers added 165,000 jobs in October and unemployment is 4.1%. A stock fall hurts most when the losses sit with lenders, which is the difference between 2001 and 2008.

Fig. 32. These are reasons a fall in AI stocks could spread. The S&P 500 closed at 7,562 on November 13, up 97% from the end of 2022 after gains of 24%, 23% and 16% in the last three years and 10.5% so far this one. The Federal Reserve's accounts put 88% of stocks and stock funds with the wealthiest tenth of households. Mark Zandi of Moody's says that if the market tumbles, a recession becomes more likely than not, and lower down, prices are rising faster than pay. "Private credit" here is Fitch Ratings' U.S. Private Credit Default Rate: about 1,200 US companies, mostly mid-sized and owned by private equity firms, that borrowed directly from private credit funds and not from banks or the bond market. It counts a missed payment, a bankruptcy, or interest that is deferred or paid in more debt. On growth, Gregory Daco of EY-Parthenon counts software and research, power, data centers and computing equipment, and finds they added an average of 1.1 points to yearly growth from early 2025 through the third quarter of 2026, with no figures given for the last two quarters. ING's narrower count is about a third, and published estimates run from near zero to 92%. The 2001 recession was mild even though tech stocks collapsed. None of them is in the four cases' arithmetic, and they are why I put the recession case at 25%. Moody's put the top tenth of earners' share of spending at about 36% three decades ago and at a record 49.7% in late 2024. After a change of method it puts the latest at 45.8%, and some economists think it is lower still. Moody's publishes no yearly series for these groups and none for the bottom half, so the first chart shows wealth, which the Federal Reserve does publish every quarter: the share of all household net worth held by the wealthiest tenth and by the bottom half of households, at each year-end and in mid-2026. The top tenth by wealth and the top tenth by income are not the same households, though they overlap heavily. On Moody's numbers the top fifth of earners do 59% of spending and the bottom 60% do 23%. Pay is rising 3.1% a year against prices at 3.7%, and the broad measure of unemployment rose to 7.9% in October. The default rate is Fitch's count over the trailing twelve months, which it began in August 2024, so it has never been through a recession; about half of the defaults were deferred interest or interest paid in more debt. Private lenders are due to supply $800 billion of the data center building. Inflation is the yearly average of the consumer price index, with September's 3.7% for 2026. The Fed's rate is the federal funds rate at each year-end, and 3.88% now. The pink bands are the recessions of 1990, 2001, 2008 and 2020. Federal debt is about 125% of the economy and the 10-year Treasury yields over 5%, so borrowing to cushion a slump costs more. A review by BMO finds that this concentration makes the economy more fragile to a fall in stocks and less fragile to a jobs shock. The insurers' $85 billion is Moody's count for June, up 24% in six months.

Sources: the S&P 500 (level, yearly returns); who owns stocks; AI and growth (EY-Parthenon, ING, the range); Axios on Moody's and Zandi; the revised top-tenth share; BMO; wealth shares (Federal Reserve, via FRED: top 1%, next 9%, bottom half); the October jobs report (Fox Business, pay, prices and underemployment); Fitch's default rate (early 2025, July 2025, October 2025, January, April, August, September); the top tenth then and now; inflation by year; the Fed's rate (FRED, recent changes); life insurers (private credit, AI holdings); banks' lending to private lenders; federal debt

Would the government step in?

Probably, and it would not be called a bailout. The likeliest form is an ownership stake in the name of national security, as with Intel.

Stipple drawing of the US Capitol dome

Washington takes an ownership stake.

If a lab or key supplier is failing

PrecedentIt took a tenth of Intel in 2025. In July OpenAI offered it 5% of the company.

In the wayNo law allows it yet, and Democrats, who won Congress this month, oppose any rescue.

Stipple drawing of a hand pulling a lever beside a pressure gauge

The Fed cuts interest rates.

Within a year of an AI bust

Precedent1987, 2001, 2008 and 2020. In 2001 it cut eleven times and the Nasdaq kept falling.

In the wayInflation. The Fed is raising rates and may do so again in December.

Stipple drawing of a metal bucket of water

Washington lends to keep credit moving.

If losses reach the lenders

PrecedentIn 2008 Congress approved $700 billion. Nearly all of it came back.

In the wayIt needs Congress, and two House Democrats have a resolution against it.

None of the three saves shareholders. A stake dilutes them, rate cuts work slowly, and loans go to the lenders. A rescue would soften a recession. It may not come in time to stop one, which is part of why I give one a 25% chance.

Fig. 33. Three forms a rescue could take, and my guess at the chance of each if its trigger happens. The chances are my judgment, and they are not the chance of the trigger. The economy gives Washington reason to act: AI building is a third of growth, and the richest tenth of households do close to half of all spending. The White House has promised no bailout, and a stake bought as a matter of defense, with the labs and their data centers treated as assets the country cannot let fail, would let it keep that promise. A stake saves the company, its lenders and its data centers and dilutes shareholders; the government bought Intel's shares at a discount and took 79.9% of AIG. No law lets Washington buy into an AI company yet, and none was moving in July. Rate cuts help borrowers and the wider market slowly and do not pay a lab's bills; traders expect another increase in December, though an AI bust would cool prices and make room to cut. Lending saves lenders and the people who rely on them; in 2020 the Fed lent to companies directly. Markets price a narrower question. In July, traders on Kalshi and Polymarket put a government stake in OpenAI this year at 18 to 24%. The same traders gave better than even odds to stakes in two quantum-computing companies and a chipmaker. The Intel deal followed arrangements with Nvidia, MP Materials and Nippon Steel. A play-money market on Manifold puts a bailout of OpenAI by the end of 2028 at 28%. Moody's finds the top tenth of earners do 49.7% of consumer spending, a record, and estimates that each added dollar of wealth lifts spending by about two cents. The Fed raised its rate in September, and nine of its 18 officials projected increases this year. The October resolution, from Representatives Greg Casar and Maxine Waters, is not binding. The adviser is David Sacks, in November 2025; OpenAI's finance chief had suggested the government could "backstop" data center loans, and the company withdrew the idea. In 2022 the S&P 500 fell about 25% from its peak to its low while the Fed raised its rate from near zero to above 4%. In 2001 the rate went from 6.5% to 1.75%. TARP's $700 billion was the amount authorized; $426 billion was paid out, and nearly all of it came back. General Motors and Chrysler received about $80 billion. The Intel stake was 9.9% for $8.9 billion, converted from grants already promised. OpenAI's offer was reported at about $42.6 billion of stock. General Motors' old shares were canceled in its 2009 bankruptcy.

Sources: spending by income (Moody's, JPMorgan Chase Institute); the Fed in 2001 (CNN, earlier crashes); the Fed now (Reuters, September, December odds, room to cut); 2008 (TARP, AIG, carmakers); Congress (the resolution, the election); Intel; OpenAI (the offer, Kalshi, Manifold, the backstop remark); David Sacks

When will we know which one we are in?

Eight dates will decide. The big ones are the days the most stock unlocks.

Nov 2026Jan 2027AprJulOctJan 2028Apr123456$858B78$967BCircles are sized by the stock that unlocks
1Nov 19, 2026 Anthropic lists its shares.

The first public price for an AI lab. A weak first week would mark down every private valuation.

2Dec 8, 2026$107B unlocksSpaceX's first large unlock.

The first real test of how much insiders sell. I assume 20%.

3Late Jan to Feb 2027 The cloud giants set 2027 spending.

If any of the four cuts, the building slows. That is the first link in the AI bust.

4March 2027$126B unlocksAnthropic reports its first full year.

Its growth rate is the number that matters most. Below 20% a quarter points to the AI bust.

5May 17, 2027$222B unlocksAnthropic's 180-day lockup ends.

The largest release at a lab. Insiders will have six months of prices to judge by.

6June 12, 2027$858B unlocksElon Musk's SpaceX stake unlocks.

The largest single date. The S&P 500 can first add SpaceX the same month.

7July 2027 OpenAI lists, if markets allow.

If it slips, its funding tightens just as its payments to Oracle begin.

8To May 2028$967B unlocksOpenAI's insiders unlock, in ten steps.

If growth has held, the selling pressure ends here.

Fig. 34. Dates come from the companies' filings and the unlock calendar in Fig. 5. A date without a day is an estimate that depends on an earnings report not yet scheduled. OpenAI has set no date for its IPO. The S&P 500 can add a new listing after a year.

Sources: SpaceX's share price; Anthropic's valuation; IPO demand; Anthropic's lockups; Steve Eisman

The Answer

What are these AI companies worth?

My probability-weighted fair value for Anthropic and OpenAI: $2.55 trillion

1
What they’re worth

of the asking price, by my odds. Paying full price means betting on faster growth than I expect.

2
The growth needed40% a year

for five years, just to justify today’s price. No company this size has managed it.

3
The evidence2 of 7

The labs clearly pass two of the seven tests today.

4
For you−16%

for a saver in an S&P 500 fund in an AI bust, and about 41% in a recession. I put the odds of one or the other at 60%.

What would change my mind?

Nine numbers I am watching, what would worry me, and which case each would make more likely.

Business spending on AI+1.65%growth in what US businesses paid for AI in October

Worry ifit is flat or falling two months in a row

ThenAI bust becomes much more likely

Anthropic's sales growth47%last quarter over the one before, down from 144%

Worry ifit drops below 20%

ThenAI bust becomes much more likely

OpenAI's fundraising$11Braised so far of the $30 billion it asked investors for

Worry ifthe round doesn't fill, or the price is cut

ThenAI bust becomes much more likely

Cost of data center debt15%the interest investors demand on some CoreWeave bonds

Worry ifrates jump for the cloud giants too

ThenEconomic recession becomes more likely

Selling after each unlock+35%SpaceX's share price after its first lockup ended

Worry ifprices fall hard after Dec. 8 or June 12

ThenAI correction or worse becomes more likely

Open models' share of AI spending27%of the money spent on OpenRouter

Worry ifit passes 40%, or a lab cuts prices

ThenAI bust becomes much more likely

Interest rates5.2%what the government pays to borrow for ten years

Worry ifit passes 5.5%, or money leaves stock funds

ThenAI correction or worse becomes more likely

Cloud giants' 2027 spending plansRisingAlphabet says a significant increase

Worry ifany of the four cuts

ThenAI bust becomes much more likely

Cost of insuring Oracle's debt290points, a record: 2.9% a year to insure against a default

Worry ifit passes 400, or the rating falls to junk

ThenEconomic recession becomes much more likely

Fig. 35. The "worry if" lines and the cases they point to are my judgment. If the numbers hold or improve, the smooth handoff gains. October was the slowest month for business AI spending in a while. Open models are the ones anyone can run. For data center debt, deals being pulled would worry me too, and for interest rates, money leaving stock funds two months running. A point is a hundredth of a percent, so 290 points is 2.9% a year.

Sources: Ramp AI Index; Anthropic's filing; OpenAI round; CoreWeave bonds; SpaceX's first unlock; OpenRouter; Treasury yields; spending plans; Oracle

Come on in. The water is warm.

— Narc

Fine Print

The Fine Print

Supporting material: what a good outcome would mean for startups, what I assumed and where I could be wrong, how the comparison companies were chosen, and whether AI will be rented or owned.

In lieu of vibes, here are detailed endnotes and citations.

Fine Print · if it works out

What does this mean for the startup ecosystem in San Francisco if this works out?

A virtuous cycle of AI buildout, in three phases. The money insiders take out seeds the next round of companies, most of them applications built on top of the models.

123Employees get liquidThey found andfund startupsThose companies growand go publicEach turn builds outmore of the AI economy
1

Employees get liquid.

OpenAI and Anthropic employ about 10,000 people. Four private sales have already offered them about $20 billion for their shares. The lockups that end in 2027 free far more.

2

They become founders and investors.

Former OpenAI staff founded Anthropic, Safe Superintelligence, Thinking Machines and Perplexity. One count finds 18 startups begun by its alumni, and others now invest.

3

Their companies grow, go public or get bought.

Then those companies' employees get liquid, and the cycle turns again, as the rest of the AI ecosystem gets built out and we learn what it is.

How much could reach Bay Area startups? My rough sum
$500BStaff shares, on paperIf staff hold about a fifth of the two labs
$100BSold in two yearsA fifth of it, as in the correction case
$63BLeft after taxAbout 37% goes to federal and California tax
$3 to 6BPut into startupsIf 5 to 10% goes to founding and funding them
+15 to 30%Added to Bay Area seed moneyWhich runs at about $10 billion a year

The same thing followed PayPal and Google. A correction would shrink the pot. It would not end the cycle.

Fig. 36. Headcounts are 4,500 at OpenAI and 5,300 at Anthropic. The four sales: OpenAI, about $1.5 billion in late 2024, $6.6 billion in October 2025 and about $7 billion in August 2026; Anthropic, $5 billion to $6 billion offered in February 2026, which some staff declined. Steps 2 and 3 are my expectation. The sum is my estimate, and the last two steps are guesses. OpenAI says current and former employees and other investors together hold 47% of it and does not split the two, so the fifth is my assumption, applied to the two labs' $2.55 trillion. The $3 billion to $6 billion is spread over two years, $1.5 billion to $3 billion a year. Pre-seed and seed deals in the United States came to $22.3 billion in 2025, and the Bay Area took 45% of seed dollars.

Sources: who owns OpenAI; seed funding (NVCA, Crunchbase); share sales (OpenAI 2026, earlier sales, Anthropic); alumni startups; headcounts (OpenAI, Anthropic)

Fine Print

What did I assume?

Lab revenue growth35%a year in the AI correction case, against plans of 70 to 77%

Could be wrongGrowth this fast has no precedent. Anthropic's fell from 144% to 47% a quarter this year.

Customers of the labsKeep payingby the meter, enough to cover the labs' promises

Could be wrongOpen models already do 72% of the work on OpenRouter at about a seventh of the price.

Unlocked stock that insiders sell20%and none of Elon Musk's

Could be wrongVenture funds could sell 35% or more. A loss of faith raises it further.

Value moved per $1 of net selling$2of lost value for each $1 of net selling

Could be wrongEstimates run from $1 to $5. Nobody has tested it at this size.

Share prices$134, $74SpaceX and Anthropic

Could be wrongAnthropic has not priced or traded. Every lockup value moves with these prices.

New money into stock funds$100Ba month, 12% of it into AI stocks

Could be wrong2026 is a record year for inflows. A falling market or higher rates pull money out.

Fine Print

What did I assume? Continued.

OpenAI's IPOJuly 2027$60 billion, with lockups like Anthropic's

Could be wrongOpenAI has set no date or size and has delayed once. Banks can release shares early.

Forced selling from borrowed moneyNonein the AI correction case

Could be wrongI cannot see loans against insider shares, or data center debt kept off the books.

How far prices fall in each caseOthers' modelspublished valuations of Anthropic, applied to OpenAI; my own guesses for the other four

Could be wrongValuation models disagree by trillions.

The chance of each case35, 25, 25, 10, 5percent: bust, recession, correction, smooth handoff, acceleration

Could be wrongThey are my judgment. Steve Eisman gives a smooth handoff 30%.

AI-linked giants' share of an S&P 500 fund35%with other stocks flat, except in the recession

Could be wrongThe share moves with prices, and in a recession the rest of the index falls too.

What I left out6 companiesand no others

Could be wrongMicrosoft and Amazon are reported to be weighing stock sales.

Fig. 37. The assumptions behind the model, what I used for each, and the slide where it does its work.

Fine Print

Anthropic and OpenAI, valued separately

Run through the same five scenarios and odds, Anthropic comes out at about three quarters of its price and OpenAI at a bit under half. They have something like $1.5 trillion of market value between them, by my estimate, against $2.55 trillion being asked.

Anthropicpriced at $1.3TOpenAIpriced at $1.25T
AI acceleration, 5%$6.76T +420%$4.07T +225%
Smooth handoff, 10%$1.89T +46%$1.14T −9%
AI correction, 25%$1.33T +2%$797B −36%
AI bust, 35%$224B −83%$135B −89%
Economic recession, 25%$139B −89%$84B −93%
Weighted by my odds$0.97T about 75% of its price$0.58T about 47% of its price

Fig. 38. The same formula as , lab by lab. Sales today are the latest quarter times four: $68 billion for Anthropic and $50 billion for OpenAI. Each scenario’s growth rate and price-to-sales ratio apply to both. The difference is new stock: OpenAI’s plan still needs $278 billion from investors, 22% more shares, so today’s holders keep about 82%; Anthropic needs none, and its $131.7 billion of cash is left out, as in the main estimate. Anthropic is also cheaper to start with, at 19 times sales against OpenAI’s 25. The two add to $1.56 trillion rather than the combined $1.52 trillion because the combined estimate spreads OpenAI’s new shares across both labs.

Fine Print

The ten IPOs, year by year: price-to-sales ratios

Only Snowflake, Snap and Facebook listed at higher price-to-sales ratios than the labs, and Rivian had almost no sales. Five years on, every ratio was lower and none was above 22. Buyers made money only where sales grew faster than the ratio fell.

$100 became $400 or more in five yearsThe other six

At Google's price-to-sales ratio, the labs' prices need sales to grow 41% a year for five years (). Seven of these ten did, each from less than $10 billion of sales. The labs start from $118 billion.

Fig. 39. Price-to-sales ratios of ten of the best-known technology IPOs since 1997, from listing to ten years on. The scale is in multiples, so equal steps are equal ratios. The first point is the value at the IPO price divided by sales in the four quarters before. Later points are year-end ratios, and the lines of newer companies end in mid-November 2026. Google's ratios before 2014 and Amazon's before 2001 are year-end market value divided by that year's sales. Rivian listed with almost no sales, so its line starts off the chart. Five years on is the end of the fifth calendar year after listing; Rivian's ends in December 2026, so its row uses today's price. Dollar outcomes follow the share price and leave out dividends. OpenAI is valued at its latest round and Anthropic at its IPO midpoint. The hollow markers use the latest quarter of sales times four, as in Fig. 7. On the past four quarters, the way the IPOs are measured, they would be 47 and 37. I chose these ten for prominence. They are not a random sample.

Sources: IPO terms and sales (Amazon, Google, Tesla, Facebook, Alibaba, Snap, Uber, Lyft, Snowflake, Rivian); annual sales; year-end prices (1, 2); prices and ratios today; ratios by year (CompaniesMarketCap, Google before 2014, Amazon before 2001)

Fine Print

Will AI be rented or owned, and what will keep a customer?

On OpenRouter, models anyone can run already do 72% of the work for 27% of the money.

My view: once a model you run yourself does 95 to 99% of the job, most customers will take it. They keep their data and trade secrets, and pay a fixed cost with no meter running.

So what will keep a customer? An AI that knows your context, protects your privacy and is genuinely useful. The labs have to build that layer before someone else does. If they don’t, Google, Meta, startups or incumbents could own the customer and run their apps on whichever model is cheapest. Anthropic sees it too: its IPO filing warns that “the degree of differentiation among advanced AI models may narrow.”

Keep your secrets. Alex Karp of Palantir says a company paying a closed lab by the token hands over its know-how: "they're going to get my IP." Satya Nadella says buyers pay twice, in money and in knowledge.

On a desk. Meta's October model runs on two linked Mac Studios.

What holds so far. Spending on AI has doubled even as prices fell, because each job uses more units. On new research math, closed models solved 90% and the best open model none.

Fig. 40. Open models' share of work and of spending on OpenRouter, an exchange where developers buy AI from many suppliers. Open models can be run by anyone; closed ones are sold by the meter. Work is counted in tokens, the unit AI is metered in, among the 50 most-used models. OpenRouter has published two figures for spending, 11% in January and 27% in September, and says the share has barely moved since summer. What businesses paid per unit of AI fell 41% from March to September. In my scenarios this risk is the path from an AI correction to an AI bust: lab revenue growth falls from 35% a year toward 20%. Alex Karp's company sells software for running open models, so he has a stake in the argument. Inside large companies, open models are 34% of AI use, up from 23% a year ago, and the share running AI mainly in a public cloud fell from 56% to 41%. Anthropic's filing warns that open models may take part of its market and push its prices down. Google's top model costs $2 and $10 until November 30.

Sources: OpenRouter (work and prices, spending, January); Epoch AI; Apple and Meta (1, cost); Broadcom survey; company use; Anthropic's filing; math test; Google (prices, free tier, labs' prices); Karp (1, 2); Nadella; prices (tenfold a year, Ramp, spending)